Second highest silver production drives record revenues, positive free cash flow, and deleveraging
COEUR D’ALENE, Idaho–(BUSINESS WIRE)–Hecla Mining Company (NYSE:HL, “Company”) today announced second quarter 2024 financial and operating results.
SECOND QUARTER HIGHLIGHTS
Operational
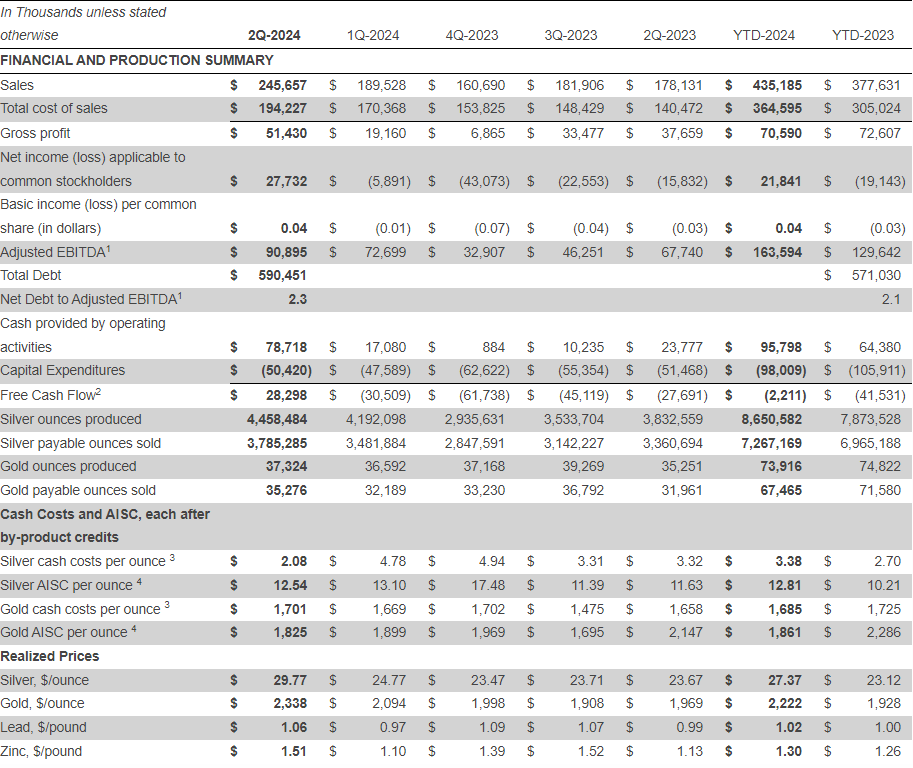
- Production of 4.5 million silver ounces, second highest in Company history.
- Lucky Friday’s silver production of 1.3 million ounces was the highest since 2000. Record mill throughput of 1,181 tons per day (“tpd”).
- Keno Hill All-Injury Frequency Rate (“AIFR”) improved by 12% to 1.98, while producing a record 0.9 million ounces of silver, a 39% increase over the first quarter of 2024.
- 2024 silver production and consolidated cost guidance reiterated, gold production guidance increased.
Financial
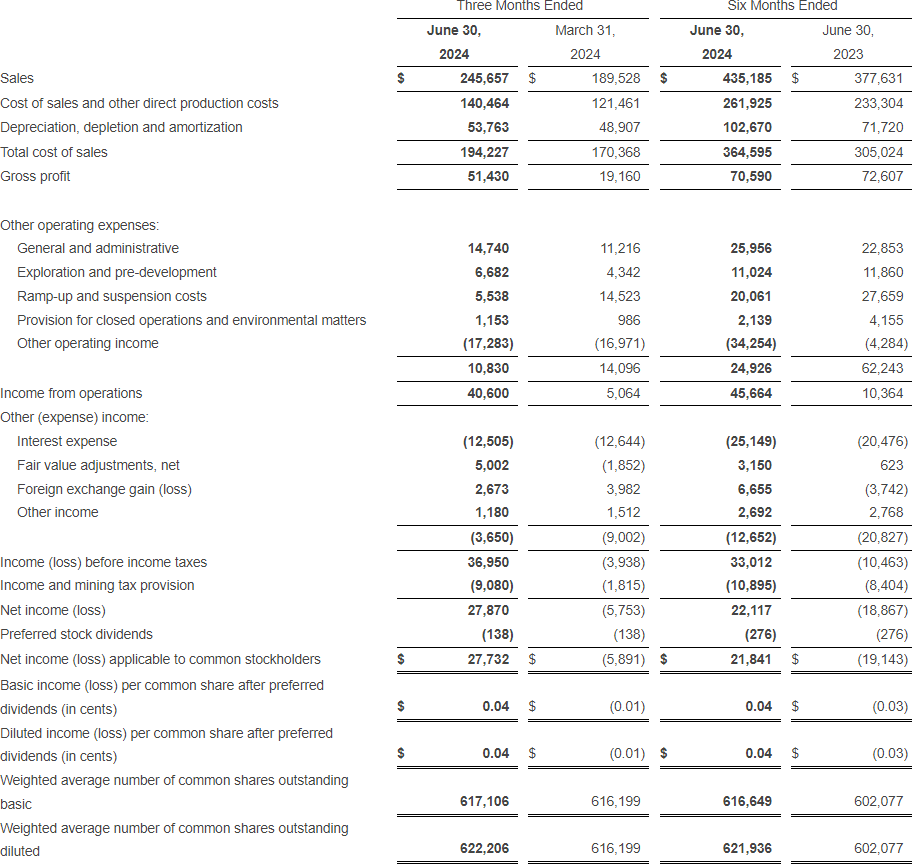
- Revenues of $245.7 million, highest in Company history, 46% from silver and 34% from gold.
- Net income applicable to common stockholders of $27.7 million or $0.04 per share, adjusted net income applicable to common stockholders of $12.3 million or $0.02 per share.1
- Trailing twelve month Adjusted EBITDA of $242.8 million, net leverage ratio* improved to 2.3.5
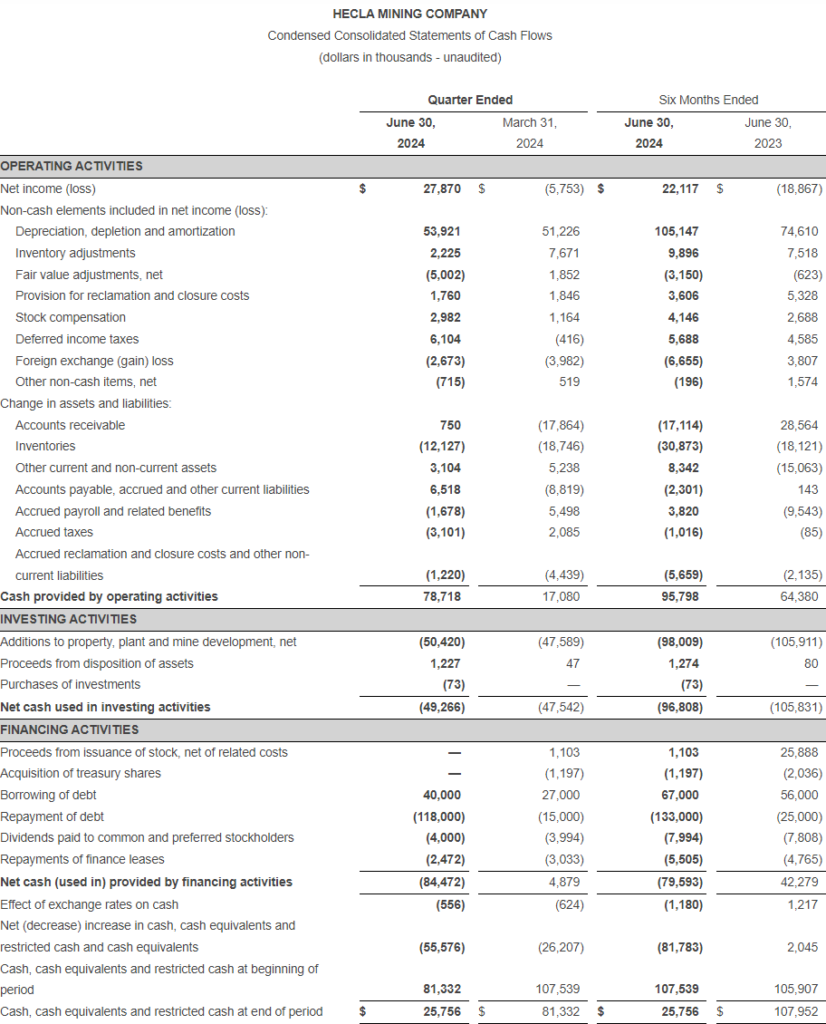
- Cash provided by operating activities of $78.7 million, free cash flow of $28.3 million.2
- Free cash flow generated at all operations, particularly strong at Greens Creek and Lucky Friday.
- Greens Creek generated $43.3 million in cash flow from operations and $33.6 million in free cash flow.2
- Lucky Friday generated $44.5 million in cash flow from operations and $33.7 million in free cash flow (including $17.8 million in insurance receipts).2
- Consolidated silver total cost of sales of $123.3 million and cash cost and all-in sustaining cost (“AISC”) per silver ounce (each after by-product credits) of $2.08 and $12.54, respectively.3,4
- Received $17.8 million in Lucky Friday insurance claim proceeds, $35.2 million received to date.
- Realized silver price of $29.77 per ounce, $0.01375 cash dividend per common share, includes silver-linked component of $0.01 per share.
Exploration
- Drilling at Keno Hill intersected significant widths of high-grade silver mineralization at both the Bermingham and Flame & Moth deposits, confirmed and expanded mineralization in both areas. Highlights include:
- Bermingham Bear Vein: 35.4 oz/ton silver, 2.2% lead, and 2.0% zinc over 20.2 feet.
- Flame & Moth Veins 0, 1, and Stockwork: 28.6 oz/ton silver, 3.3% lead, and 6.2% zinc over 22.3 feet.
- Drilling at Greens Creek intersected strong mineralization in multiple ore zones adding confidence and expanding mineralization. Most notably, the West Zone: 72.7 oz/ton silver, 0.23 oz/ton gold, 9.6% zinc, and 5.2% lead over 26.9 feet.
* Net Leverage ratio is calculated as long-term debt and finance leases less cash to adjusted EBITDA.
“Hecla saw significant improvement in gross profit and free cash flow during the quarter – with our gross profit increasing more than 1.5 times over the prior quarter, and free cash flow generation of $28.3 million, which allowed us to reduce our net debt by $25.1 million,” said Cassie Boggs, interim President and CEO. “This financial performance was driven by strong results and free cash flow generated at Greens Creek and Lucky Friday, while Keno Hill’s ramp-up progressed well with throughput in excess of 400 tpd. With this strong performance and favorable price environment, we will continue our focus on reducing debt while continuing to invest in our operations and exploration programs.”
Boggs continued, “At Keno Hill, while the ramp-up has gone well, our focus will be to ensure Hecla’s culture of safety and environmental excellence is instilled in the operational and mining practices. As a result, we expect costs and investment at the mine will remain at current levels as more work is required to deliver long-term value. We are committed to collaborating and working with the First Nation of Na-Cho Nyäk Dun as they work through the clean-up work after the heap leach failure at Victoria Gold’s Eagle Gold mine. We have offered our assistance and will continue to be available where we can during this time of crisis.”
Boggs concluded, “Silver demand is projected to remain robust, supported by the growing solar demand as the world transitions to a cleaner, greener economy. With Hecla’s silver production expected at about 17 million ounces this year, potentially increasing to 20 million ounces by 2026, Hecla remains the fastest growing established silver producer with growth in the best mining jurisdictions.”
FINANCIAL OVERVIEW
In the following table and throughout this release, “total cost of sales” is comprised of cost of sales and other direct production costs and depreciation, depletion and amortization, and comparisons are made to the “prior quarter” which refers to the first quarter of 2024.
Sales in the second quarter increased by 30% from the prior quarter to $245.7 million due to higher quantities sold of all metals produced except zinc, as well as higher realized prices for all metals. The higher sales volumes were due to a full quarter of production at Lucky Friday, increased sales at Keno Hill and Casa Berardi, partially offset by lower volumes sold at Greens Creek.
Gross profit increased by 168% to $51.4 million, reflecting higher realized prices and higher sales volumes at Lucky Friday and Casa Berardi.
Net income applicable to common stockholders for the quarter was $27.7 million, a $33.6 million improvement from the prior quarter, primarily because of:
- Ramp-up and suspension costs decreased by $9.0 million to $5.5 million, reflecting a full quarter of Lucky Friday production following the restart in January and improved performance at Keno Hill.
- Fair value adjustments, net increased by $6.9 million due to unrealized gains on both our derivative contracts not designated as accounting hedges, and marketable equity securities portfolio.
The above items were partly offset by:
- Income and mining tax provision increased by $7.3 million to $9.1 million reflecting higher taxable income of our US operations.
- General and administrative costs increased by $3.5 million due to costs incurred related to the former CEO’s retirement, which were primarily non cash equity compensation costs.
Consolidated silver total cost of sales in the second quarter increased by 14% to $123.3 million, reflecting a full quarter of production at Lucky Friday and increased sales at Keno Hill. Consolidated cash costs and AISC per silver ounce, each after by-product credits, were $2.08 and $12.54 respectivelyand only include costs of Greens Creek and Lucky Friday for the full quarter (commercial production has not been declared at Keno Hill). The decrease in cash costs and AISC per silver ounce was due to higher silver production and higher by-product credits partially offset by higher production costs.3,4
Consolidated gold total cost of sales were $67.3 million, reflecting an increase in sales volumes at Casa Berardi. Cash costs and AISC per gold ounce, each after by-product credits, were $1,701 and $1,825, respectively.3,4 The increase in cash costs per ounce was attributable to higher contractor, maintenance and consumables costs partially offset by higher gold production at Casa Berardi, with AISC also impacted by lower sustaining capital.
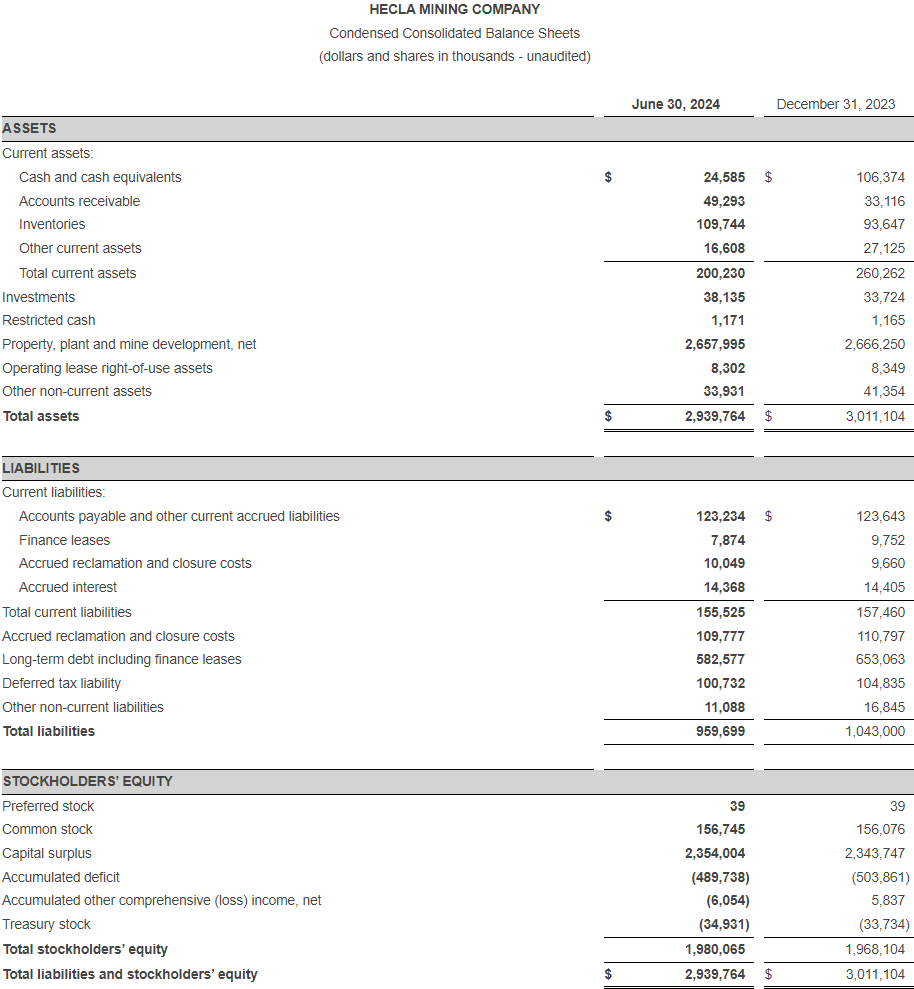
Adjusted EBITDA for the quarter was a record $90.9 million, an increase of $18.2 million primarily due to higher gross profit for the reasons mentioned above.5 The net leverage ratio improved to 2.3 from 2.7 in the prior quarter due to higher adjusted EBITDA and a reduction in net debt of $25.1 million as the Company decreased borrowings under its revolving credit facility.5 Cash and cash equivalents at the end of the quarter were $24.6 million and included $62.0 million drawn on the revolving credit facility. Borrowing on the revolving credit facility decreased by $78 million in the quarter as the Company utilized free cash flow and insurance proceeds to reduce the drawn amount. At current price levels and expected production, the Company anticipates the net leverage ratio to return to the Company’s target of less than 2.0 by the end of the year 2024.5
Cash provided by operating activities was $78.7 million and increased by $61.6 million due to an increase in net income adjusted for non-cash items of $32.3 million and a favorable working capital change of $29.3 million.
Capital expenditures of $50.4 million increased by $2.8 million from the prior quarter. Capital investments at the operations were as follows (i) $11.7 million at Greens Creek related to development, equipment purchases and surface projects, (ii) $12.4 million at Casa Berardi, primarily related to tailings construction activities, (iii) $10.8 million at Lucky Friday primarily related to development, pre-production drilling, and equipment purchases, and (iv) $14.5 million at Keno Hill, related to underground development, mobile equipment purchases, and camp expansion.
Free cash flow for the quarter was $28.3 million, compared to negative $30.5 million in the prior quarter.2 The improvement in free cash flow was attributable to a full quarter of Lucky Friday production and improved performance at Keno Hill which led to higher sales volumes and realized prices.
Forward Sales Contracts for Base Metals and Foreign Currency
The Company uses financially settled forward sales contracts to manage exposure to zinc and lead price changes in forecasted concentrate shipments. On June 30, 2024, the Company had contracts covering approximately 7% and 34% of the forecasted payable zinc and lead production, respectively, through 2026, at an average zinc price of $1.37 per pound and a lead price of $0.99 per pound.
The Company also manages Canadian dollar (“CAD”) exposure through forward contracts. At June 30, 2024, the Company had hedged approximately 54% of forecasted Casa Berardi and Keno Hill CAD- denominated direct production costs through 2026 at an average CAD/USD rate of 1.33. The Company has also hedged approximately 21% of Casa Berardi and Keno Hill’s projected CAD-denominated total capital expenditures through 2026 at 1.35.
OPERATIONS OVERVIEW
Greens Creek Mine – Alaska
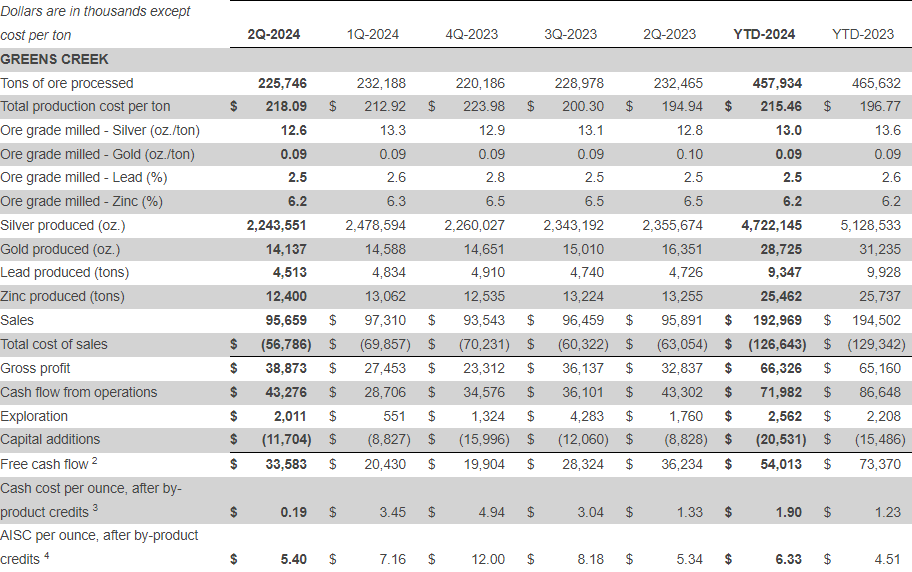
Greens Creek produced 2.2 million ounces of silver during the quarter, a decrease of 9% compared to the prior quarter, primarily due to lower mined grades which reverted to plan. Throughput for the quarter averaged 2,481 tpd, a decline of 3% as multiple mill maintenance projects including installation of a new primary screen, relining of the grinding circuit, and concentrate thickener rake replacement, were completed during the quarter. By-product metal production was lower primarily due to lower grades.
Sales in the quarter were $95.7 million, a 2% decrease due to lower quantities of all metals sold, partially offset by higher realized prices. Lower sales volumes were also attributable to an increase in silver and zinc concentrate inventory due to the timing of shipments at quarter end. Total cost of sales decreased to $56.8 million, reflecting lower sales volumes. Cash costs and AISC per silver ounce, each after by-product credits, were $0.19 and $5.40, respectively, and decreased over the prior quarter due to lower treatment charges and higher by-product credits (higher realized prices for by-products offset lower production volumes).3,4
Cash flow from operations was $43.3 million, an increase of $14.6 million, primarily due to higher realized prices. Free cash flow for the quarter was $33.6 million, an increase of $13.2 million, as higher cash flow from operations was partially offset by planned higher capital investment during the quarter.
Lucky Friday Mine – Idaho
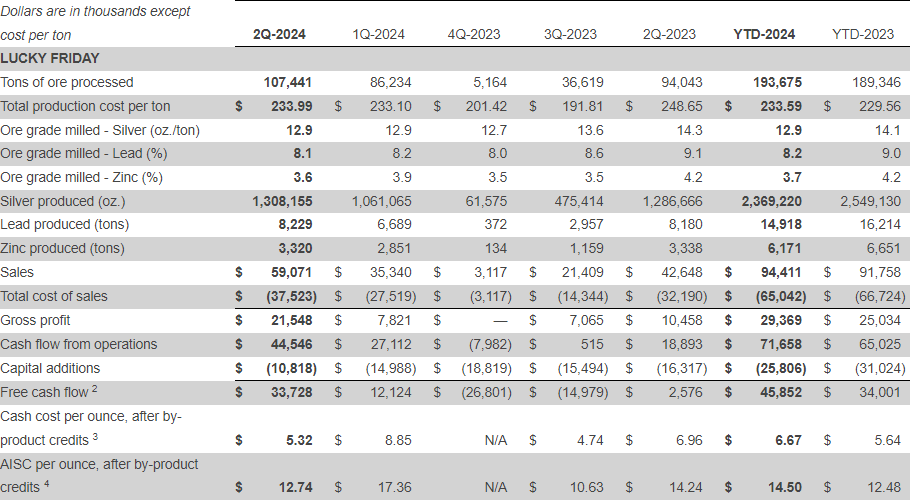
Lucky Friday produced 1.3 million ounces of silver, the highest quarterly production since 2000 and an increase of 23% over the prior quarter, reflecting a full quarter of production. Mill throughput of 1,181 tpd also set a record in the mine’s 80-year history.
Sales in the second quarter were $59.1 million, and total cost of sales were $37.5 million, compared to $35.3 million and $27.5 million, respectively in the prior quarter, reflecting higher sales volumes and realized prices. Cash costs and AISC per silver ounce, each after by-product credits, were $5.32 and $12.74 respectively, and were lower due to higher production, but higher than guidance due to higher labor and contractor costs, and higher profit sharing (under the collective bargaining agreement) reflecting the strong performance and higher realized prices.
Cash flow from operations was $44.5 million and includes $17.8 million in insurance proceeds received during the quarter, as well as positive working capital adjustments due to ramp-up being achieved in the prior quarter.
Capital expenditures for the quarter were $10.8 million, and included capital development, mobile equipment purchases, and completion of the rehabilitation work related to the secondary egress (#2 shaft). Free cash flow for the quarter was $33.7 million, an increase of $21.6 million reflecting a full quarter of operations and the collection of $17.8 million of insurance proceeds.2 The Company’s underground insurance sublimit coverage is $50 million, of which $35.2 million has been received to date and the Company expects to receive the remaining $14.8 million in insurance proceeds before the end of the year.
Keno Hill – Yukon Territory
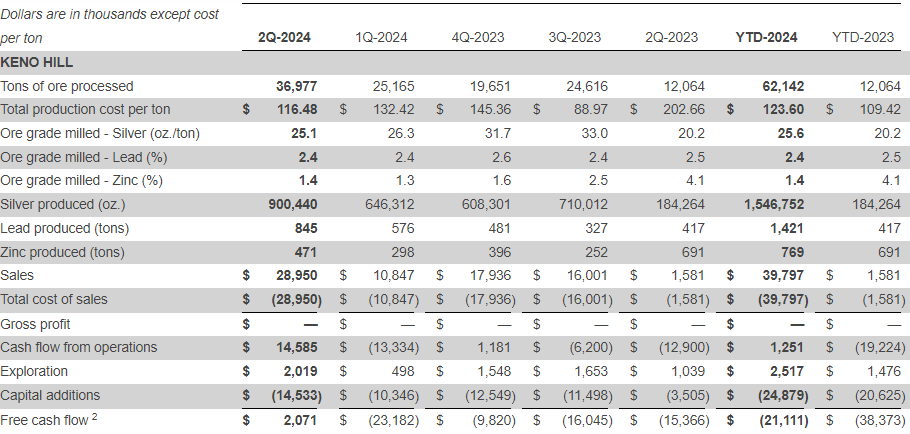
At Keno Hill, ramp-up continued and the mine produced 900,440 ounces of silver in the second quarter, a record for the operation, and an increase of 39% over the prior quarter. Throughput in the quarter averaged 406 tpd, an increase of 47%, partially offset by lower silver grades, which were 25.1 ounces per ton. Production commenced from the Flame & Moth deposit at the beginning of July and is expected to supplement ore production from the Bermingham deposit.
Sales during the quarter were $29.0 million, an increase of $18.1 million over the prior quarter due to a combination of higher realized prices and volumes. Ramp-up costs during the quarter were $1.8 million and are included in ramp-up and suspension costs on the consolidated statement of operations. Expenditures on production costs, including ramp-up costs (excluding depreciation), totaled $27.4 million for the quarter, higher than the guidance of $15-$17 million per quarter due to increased production volumes and throughput. Capital investments during the quarter were $14.5 million for underground and surface infrastructure projects including camp expansion, mine development, and mobile equipment purchases.
The Company continues to make progress on the cemented tails batch plant, a critical infrastructure project, which will facilitate a change in the mining method at the Bermingham deposit to underhand mining, which should improve safety and productivity. Construction of the project is expected to be completed in the fourth quarter with full conversion to underhand mining expected by the end of 2025. Other key capital projects in progress are expansion of camp facilities, water treatment plant upgrades, and key equipment purchases.
Keno Hill’s AIFR, one of several improving measures, improved 12% to 1.98. As the Keno Hill operation moves towards full production, the Company expects sustained investment in long-term infrastructure to support sustainable and safe mining operations throughout the current reserve mine plan of eleven years. Continued focus on safety, environmental, permitting, and mining practices, and relations with First Nation of Na-Cho Nyäk Dun are key to maintaining and increasing production levels and delivering long-term value at this operation.
Casa Berardi – Quebec
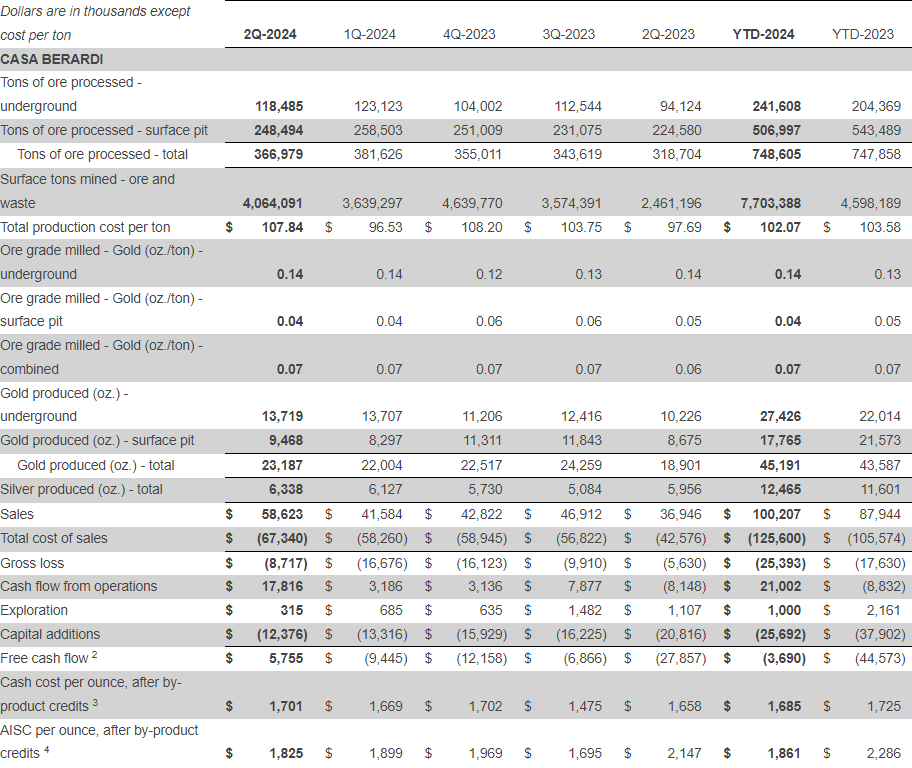
Casa Berardi produced 23,187 ounces of gold in the quarter, an increase of 5% over the prior quarter as a 7% increase in throughput and recoveries were offset by lower grades from the 160 pit. The mill operated at an average of 4,194 tpd during the quarter.
Sales were $58.6 million, a 41% increase due to a combination of higher sales volumes and realized prices. Total cost of sales were $67.3 million, a 16% increase compared to the prior quarter, attributable to higher sales volumes and higher costs. Cash costs and AISC per gold ounce, each after by-product credits increased to $1,701 and $1,825, respectively, primarily due to higher production costs attributable to higher contractor costs and consumables (higher volumes). AISC was favorably impacted by planned lower sustaining capital spend. 3,4
Cash flow from operations was $17.8 million, an increase of $14.6 million over the prior quarter. Capital investments for the quarter totaled $12.4 million ($2.7 million in sustaining and $9.7 million in growth) and were primarily related to construction costs for tailings facilities. Free cash flow for the quarter was $5.8 million and improved by $15.2 million from the prior quarter due to higher cash flow from operations and lower capital spending.2
With the increase in gold prices, the Company has completed a stope-by-stope analysis of the west mine underground operations and is extending the underground operations for the remainder of 2024. Please refer to the guidance section of the release for updated production guidance for the mine.
EXPLORATION AND PRE-DEVELOPMENT
Exploration and pre-development expenses totaled $6.7 million for the quarter. Exploration activities during the quarter primarily focused on underground definition and exploration drilling at Greens Creek, Keno Hill, and Casa Berardi.
Keno Hill
At Keno Hill, underground drilling during the first half of 2024 continued to intersect high-grade silver mineralization over significant widths and highlights the potential for high-grade silver mineralization in the district. Underground definition drilling is focused on extending mineralization and resource conversion in the high-grade Bermingham Bear Zone veins (Bear, Footwall, and Main Vein zones) and in the Flame & Moth veins. During the quarter, two underground drills completed over 13,000 feet of definition drilling. Three surface drills were also active on the property testing multiple targets including the Bermingham Deep, Bermingham Townsite, Elsa17-Dixie, and Silver Spoon target areas that have potential for the discovery of additional large high-grade silver deposits. Over 25,000 feet of surface exploration drilling has been completed in 13 drillholes.
Assay highlights include (reported widths are estimates of true width):
- Bear Vein: 35.4 oz/ton silver, 2.2% lead, and 2.0% zinc over 20.2 feet
- Includes: 150.8 oz/ton silver, 9.9% lead, and 4.8% zinc over 3.0 feet
- Main Vein: 29.8 oz/ton silver, 1.6% lead, and 0.2% zinc over 10.3 feet
- Includes: 86.0 oz/ton silver, and 8.0% lead over 0.8 feet.
- Includes: 203.9 oz/ton silver, 8.4% lead, and 0.1% zinc over 0.9 feet
- Flame & Moth Veins 0, 1, Stockwork: 28.6 oz/ton silver, 3.3% lead, and 6.2% zinc over 22.3 feet
- Includes: 129.8 oz/ton silver, 5.7% lead, and 6.6% zinc over 1.7 feet
- Includes: 35.1 oz/ton silver, 6.6% lead, and 10.6% zinc over 7.4 feet
Greens Creek
At Greens Creek, three underground drills completed over 44,000 feet of drilling focused on resource conversion and exploration to extend mineralization of known resources. Drilling was focused in the 9a, 200 South, 5250, NWW, West, Gallagher, and Southwest Bench areas. In addition, two helicopter-supported surface exploration drills completed over 8,000 feet of drilling (assays pending) focused on expanding the Upper Plate Zone to the west of current resources and drill testing the Mammoth target.
Assay highlights include (reported widths are estimates of true width):
- NWW Zone: 32.0 oz/ton silver, 0.18 oz/ton gold, 14.2% zinc, and 5.0% lead over 19.3 feet
- 200 South Zone: 15.7 oz/ton silver, 0.02 oz/ton gold, 2.0% zinc, and 1.0% lead over 26.9 feet
- West Zone: 72.7 oz/ton silver, 0.23 oz/ton gold, 9.6% zinc, and 5.2% lead over 26.9 feet
At Casa Berardi, underground drilling is continuing to evaluate the remaining underground stopes and mineral zone extensions.
Detailed complete drill assay highlights can be found in Table A at the end of the release.
DIVIDENDS
Common Stock
TheBoard of Directors declared a quarterly cash dividend of $0.01375 per share of common stock, consisting of $0.00375 per share for the minimum dividend component and $0.01 per share for the silver-linked component. The common stock dividend is payable on or about September 5, 2024, to stockholders of record on August 26, 2024. The quarter realized silver price was $29.77, satisfying the criterion for the Company’s common stock silver-linked dividend policy component.
Preferred Stock
TheBoard of Directors declared a quarterly cash dividend of $0.875 per share of preferred stock, payable on or about October 1, 2024, to stockholders of record on September 16, 2024.
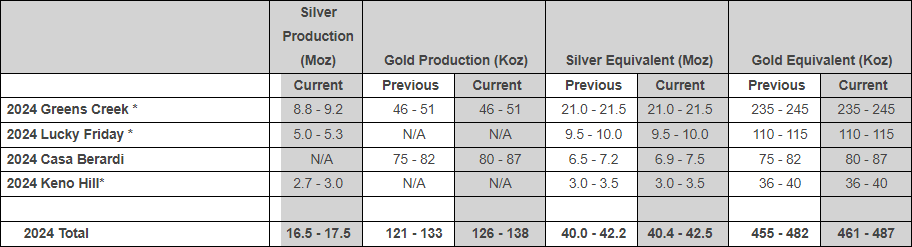
2024 GUIDANCE 6
The Company has updated its annual gold production, cost and capital guidance as below. There is no change to silver production guidance.
2024 Production Outlook
Gold production guidance for Casa Berardi is increased to reflect the extension of underground operations until the end of the year 2024.
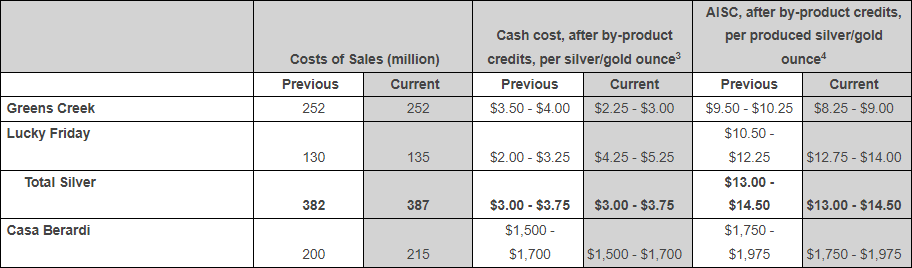
2024 Cost Outlook
At Greens Creek, guidance for cash costs and AISC per silver ounce, each after by-product credits, has decreased to reflect higher by-product credits (due to strong realized prices), and strong silver production. AISC per silver ounce, after by-product credits, is also favorably impacted by lower expected capital investment during the remaining year.
At Lucky Friday, guidance for cash costs and AISC per silver ounce, each after by-product credits, has increased to reflect higher labor and contractor costs incurred through the first half of 2024, and expected higher profit sharing costs (under the collective bargaining agreement) during the remaining year attributable to higher prices.
At Keno Hill, expenditures on production costs, excluding depreciation, are expected to be $25-$27 million per quarter for the remaining year to reflect current levels of expenditures associated with the increase in production volumes.
For Casa Berardi, cost of sales guidance is increased to include expected underground production costs for the rest of 2024. Cash costs and AISC, per gold ounce, each after by-product credits is unchanged as the increased costs are offset by higher expected production.
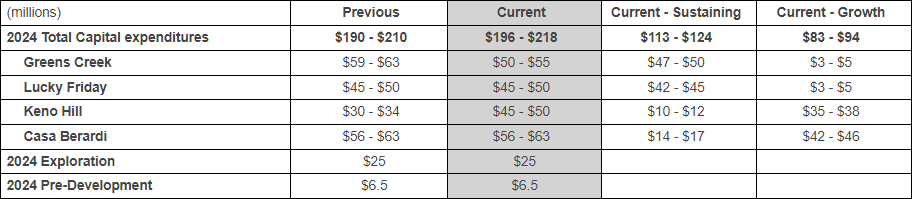
2024 Capital and Exploration Guidance
The Company is increasing capital guidance for the year to reflect higher expected capital investment at Keno Hill, partially offset by lower capital investment at Greens Creek. At Greens Creek, capital investment guidance is reduced to reflect lower capital investment through the first half of the year and timing of equipment purchases and capital projects.
At Keno Hill, increase in capital investment guidance is primarily attributable to increased underground development, water treatment plant upgrades, camp expansion, equipment purchases, and cemented tails batch plant.
Exploration and pre-development guidance is unchanged.
CONFERENCE CALL AND WEBCAST
A conference call and webcast will be held on Wednesday, August 7, 2024, at 10:00 a.m. Eastern Time to discuss these results. The Company recommends that the participants dial in at least 10 minutes before the call commencement. You may join the conference call by dialing toll-free 1-888-330-2391 or for international callers dial 1-240-789-2702. The Conference ID is 4812168 and must be provided when dialing in. Hecla’s live and archived webcast can be accessed at https://events.q4inc.com/attendee/202789141 or www.hecla.com under Investors.
VIRTUAL INVESTOR EVENT
Hecla will be holding a Virtual Investor Event on Wednesday, August 7, from 12:00 p.m. to 1:30 p.m. Eastern Time.
Hecla invites shareholders, investors, and other interested parties to schedule a personal, 30-minute virtual meeting (video or telephone) with a member of senior management to discuss Financial, Exploration, Operations, ESG or general matters. Click on the link below to schedule a call (or copy and paste the link into your web browser). You can select a topic once you have entered the meeting calendar. If you are unable to book a time, either due to high demand or for other reasons, please reach out to Anvita M. Patil, Vice President, Investor Relations and Treasurer at hmc-info@hecla.com or 208-769-4100.
One-on-One meeting URL: https://calendly.com/2024-aug-vie
ABOUT HECLA
Founded in 1891, Hecla Mining Company (NYSE: HL) is the largest silver producer in the United States. In addition to operating mines in Alaska, Idaho, and Quebec, Canada, the Company is developing a mine in the Yukon, Canada, and owns a number of exploration and pre-development projects in world-class silver and gold mining districts throughout North America.
NOTES
Non-GAAP Financial Measures
Non-GAAP financial measures are intended to provide additional information only and do not have any standard meaning prescribed by United States generally accepted accounting principles (“GAAP”). These measures should not be considered in isolation or as a substitute for measures of performance prepared in accordance with GAAP. The non-GAAP financial measures cited in this release and listed below are reconciled to their most comparable GAAP measure at the end of this release.
(1) Adjusted net income (loss) applicable to common stockholders is a non-GAAP measurement, a reconciliation of which to net income (loss) applicable to common stockholders, the most comparable GAAP measure, can be found at the end of the release. Adjusted net income (loss) applicable to common stockholders is a measure used by management to evaluate the Company’s operating performance but should not be considered an alternative to net income (loss) applicable to common stockholders as defined by GAAP. They exclude certain impacts which are of a nature which we believe are not reflective of our underlying performance. Management believes that adjusted net income (loss) applicable to common stockholders per common share provides investors with the ability to better evaluate our underlying operating performance.
(2) Free cash flow is a non-GAAP measure calculated as cash provided by operating activities less capital expenditures. Cash provided by operating activities for the Greens Creek, Lucky Friday, and Casa Berardi operating segments excludes exploration and pre-development expense, as it is a discretionary expenditure and not a component of the mines’ operating performance. Capital expenditures refers to Additions to properties, plants and equipment from the Consolidated Statements of Cash Flows, net of finance leases.
(3) Cash cost, after by-product credits, per silver and gold ounce is a non-GAAP measurement, a reconciliation of total cost of sales, can be found at the end of the release. It is an important operating statistic that management utilizes to measure each mine’s operating performance. It also allows the benchmarking of performance of each mine versus those of our competitors. As a primary silver mining company, management also uses the statistic on an aggregate basis – aggregating the Greens Creek and Lucky Friday mines to compare performance with that of other silver mining companies. Similarly, the statistic is useful in identifying acquisition and investment opportunities as it provides a common tool for measuring the financial performance of other mines with varying geologic, metallurgical and operating characteristics. In addition, the Company may use it when formulating performance goals and targets under its incentive program.
(4) All-in sustaining cost (AISC), after by-product credits, is a non-GAAP measurement, a reconciliation of which to total cost of sales, the closest GAAP measurement, can be found in the end of the release. AISC, after by-product credits, includes total cost of sales and other direct production costs, expenses for reclamation at the mine sites and all site sustaining capital costs. AISC, after by-product credits, is calculated net of depreciation, depletion, and amortization and by-product credits. Prior year presentation has been adjusted to conform with current year presentation.
(5) Adjusted EBITDA is a non-GAAP measurement, a reconciliation of which to net loss, the most comparable GAAP measure, can be found at the end of the release. Adjusted EBITDA is a measure used by management to evaluate the Company’s operating performance but should not be considered an alternative to net loss, or cash provided by operating activities as those terms are defined by GAAP, and does not necessarily indicate whether cash flows will be sufficient to fund cash needs. In addition, the Company may use it when formulating performance goals and targets under its incentive program. Net debt to adjusted EBITDA is a non-GAAP measurement, a reconciliation of which to debt and net income (loss), the most comparable GAAP measurements, can be found at the end of the release. It is an important measure for management to measure relative indebtedness and the ability to service the debt relative to its peers. It is calculated as total debt outstanding less total cash on hand divided by adjusted EBITDA.
(6) Expectations for 2024 include silver, gold, lead, and zinc production from Greens creek, Lucky Friday, Keno Hill, and Casa Berardi converted using gold $1,950/oz, silver $22.50/oz, zinc $1.20/lb, and lead $0.95/lb. Numbers are rounded.
Current GAAP measures used in the mining industry, such as total cost of goods sold, do not capture all the expenditures incurred to discover, develop and sustain silver and gold production. Management believes that AISC is a non-GAAP measure that provides additional information to management, investors and analysts to help (i) in the understanding of the economics of our operations and performance compared to other producers and (ii) in the transparency by better defining the total costs associated with production. Similarly, the statistic is useful in identifying acquisition and investment opportunities as it provides a common tool for measuring the financial performance of other mines with varying geologic, metallurgical and operating characteristics. In addition, the Company may use it when formulating performance goals and targets under its incentive program.
Cautionary Statement Regarding Forward Looking Statements, Including 2024 Outlook
This news release contains “forward-looking statements” within the meaning of Section 27A of the Securities Act of 1933, as amended, and Section 21E of the Securities Exchange Act of 1934, as amended, which are intended to be covered by the safe harbor created by such sections and other applicable laws, including Canadian securities laws. Words such as “may”, “will”, “should”, “expects”, “intends”, “projects”, “believes”, “estimates”, “targets”, “anticipates” and similar expressions are used to identify these forward-looking statements. Such forward-looking statements may include, without limitation: (i) the Company will continue to focus on reducing debt while continuing to invest in operations and exploration programs; (ii) silver demand is projected to remain robust, supported by the growing solar demand as the world transitions to a cleaner, greener economy; (iii) the Company expects to produce 17 million ounces of silver in 2024 and increase production potentially up to 20 million ounces by 2026; (iv) at current price levels and expected production, the Company anticipates the net leverage ratio (net debt to Adjusted EBITDA) will return to less than 2 by 2024 year-end; (v) the Company expects to receive an additional $14.8 million in insurance proceeds in 2024; (vi) Casa Berardi may continue underground production throughout 2024; (vii) construction of cemented tails batch plant project is expected to 1) be completed in the fourth quarter of 2024, 2) improve safety and productivity at the Bermingham deposit, and 3) facilitate the change of mining method to underhand mining by the end of 2025; (viii) projected total cost of sales, as well as cash cost and AISC per ounce (in each case after by-product credits) for Greens Creek, Lucky Friday, and Casa Berardi individually and for silver overall for 2024; (ix) Company-wide and mine-specific estimated spending on capital, exploration and predevelopment for 2024 and (x) Company-wide and mine-specific silver, gold, silver-equivalent and gold-equivalent ounces of production for 2024. The material factors or assumptions used to develop such forward-looking statements or forward-looking information include that the Company’s plans for development and production will proceed as expected and will not require revision as a result of risks or uncertainties, whether known, unknown or unanticipated, to which the Company’s operations are subject.
Estimates or expectations of future events or results are based upon certain assumptions, which may prove to be incorrect, which could cause actual results to differ from forward-looking statements. Such assumptions, include, but are not limited to: (i) there being no significant change to current geotechnical, metallurgical, hydrological and other physical conditions; (ii) permitting, development, operations and expansion of the Company’s projects being consistent with current expectations and mine plans; (iii) political/regulatory developments in any jurisdiction in which the Company operates being consistent with its current expectations; (iv) the exchange rate for the USD/CAD being approximately consistent with current levels; (v) certain price assumptions for gold, silver, lead and zinc; (vi) prices for key supplies being approximately consistent with current levels; (vii) the accuracy of our current mineral reserve and mineral resource estimates; (viii) there being no significant changes to the availability of employees, vendors and equipment; (ix) the Company’s plans for development and production will proceed as expected and will not require revision as a result of risks or uncertainties, whether known, unknown or unanticipated; (x) counterparties performing their obligations under hedging instruments and put option contracts; (xi) sufficient workforce is available and trained to perform assigned tasks; (xii) weather patterns and rain/snowfall within normal seasonal ranges so as not to impact operations; (xiii) relations with interested parties, including First Nations and Native Americans, remain productive; (xiv) maintaining availability of water rights; (xv) factors do not arise that reduce available cash balances; and (xvi) there being no material increases in our current requirements to post or maintain reclamation and performance bonds or collateral related thereto.
In addition, material risks that could cause actual results to differ from forward-looking statements include but are not limited to: (i) gold, silver and other metals price volatility; (ii) operating risks; (iii) currency fluctuations; (iv) increased production costs and variances in ore grade or recovery rates from those assumed in mining plans; (v) community relations; and (vi) litigation, political, regulatory, labor and environmental risks. For a more detailed discussion of such risks and other factors, see the Company’s 2023 Form 10-K filed on February 15, 2024 and Form 10-Q expected to be filed on August 7, 2024, for a more detailed discussion of factors that may impact expected future results. The Company undertakes no obligation and has no intention of updating forward-looking statements other than as may be required by law.
Qualified Person (QP)
Kurt D. Allen, MSc., CPG, VP – Exploration of Hecla Mining Company and Keith Blair, MSc., CPG, Chief Geologist of Hecla Limited, who serve as a Qualified Person under S-K 1300 and NI 43-101, supervised the preparation of the scientific and technical information concerning Hecla’s mineral projects in this news release. Technical Report Summaries for each of the Company’s Greens Creek, Lucky Friday, Casa Berardi and Keno Hill properties are filed as exhibits 96.1 – 96.4 respectively, to the Company’s Annual Report on Form 10-K for the year ended December 31, 2023 and are available at www.sec.gov. Information regarding data verification, surveys and investigations, quality assurance program and quality control measures and a summary of analytical or testing procedures for (i) the Greens Creek Mine are contained in its Technical Report Summary and in a NI 43-101 technical report titled “Technical Report for the Greens Creek Mine” effective date December 31, 2018, (ii) the Lucky Friday Mine are contained in its Technical Report Summary and in its technical report titled “Technical Report for the Lucky Friday Mine Shoshone County, Idaho, USA” effective date April 2, 2014, (iii) Casa Berardi are contained in its Technical Report Summary and in its NI 43-101 technical report titled “Technical Report on the Casa Berardi Mine, Northwestern Quebec, Canada” effective date December 31, 2023 and (iv) Keno Hill are contained in its Technical Report Summary and in its NI 43-101 technical report titled “Technical Report on the Keno Hill Mine, Yukon, Canada” effective date December 31, 2023. Also included in each technical report is a description of the key assumptions, parameters and methods used to estimate mineral reserves and resources and a general discussion of the extent to which the estimates may be affected by any known environmental, permitting, legal, title, taxation, socio-political, marketing, or other relevant factors. Mr. Allen and Mr. Blair reviewed and verified information regarding drill sampling, data verification of all digitally collected data, drill surveys and specific gravity determinations relating to all the mines. The review encompassed quality assurance programs and quality control measures including analytical or testing practice, chain-of-custody procedures, sample storage procedures and included independent sample collection and analysis. This review found the information and procedures meet industry standards and are adequate for Mineral Resource and Mineral Reserve estimation and mine planning purposes.
Non-GAAP Measures
(Unaudited)
Reconciliation of Total Cost of Sales to Cash Cost, Before By-product Credits and Cash Cost, After By-product Credits (non-GAAP) and All-In Sustaining Cost, Before By-product Credits and All-In Sustaining Cost, After By-product Credits (non-GAAP)
The tables below present reconciliations between the most comparable GAAP measure of total cost of sales to the non-GAAP measures of (i) Cash Cost, Before By-product Credits, (ii) Cash Cost, After By-product Credits, (iii) AISC, Before By-product Credits and (iv) AISC, After By-product Credits for our operations and for the Company for the three months ended June 30, 2024, March 31, 2024, December 31, 2023, September 30, 2023, June 30, 2023 and the six months ended June 30, 2024 and 2023.
Cash Cost, After By-product Credits, per Ounce and AISC, After By-product Credits, per Ounce are measures developed by precious metals companies (including the Silver Institute and the World Gold Council) in an effort to provide a uniform standard for comparison purposes. There can be no assurance, however, that these non-GAAP measures as we report them are the same as those reported by other mining companies.
Cash Cost, After By-product Credits, per Ounce is an important operating statistic that we utilize to measure each mine’s operating performance. We use AISC, After By-product Credits, per Ounce as a measure of our mines’ net cash flow after costs for reclamation and sustaining capital. This is similar to the Cash Cost, After By-product Credits, per Ounce non-GAAP measure we report, but also includes reclamation and sustaining capital costs. Current GAAP measures used in the mining industry, such as cost of goods sold, do not capture all the expenditures incurred to discover, develop and sustain silver and gold production. Cash Cost, After By-product Credits, per Ounce and AISC, After By-product Credits, per Ounce also allow us to benchmark the performance of each of our mines versus those of our competitors. As a silver and gold mining company, we also use these statistics on an aggregate basis – aggregating the Greens Creek and Lucky Friday mines to compare our performance with that of other silver mining companies. Similarly, these statistics are useful in identifying acquisition and investment opportunities as they provide a common tool for measuring the financial performance of other mines with varying geologic, metallurgical and operating characteristics.
Cash Cost, Before By-product Credits and AISC, Before By-product Credits include all direct and indirect operating cash costs related directly to the physical activities of producing metals, including mining, processing and other plant costs, third-party refining expense, on-site general and administrative costs, royalties and mining production taxes. AISC, Before By-product Credits for each mine also includes reclamation and sustaining capital costs. AISC, Before By-product Credits for our consolidated silver properties also includes corporate costs for general and administrative expense and sustaining capital costs. By-product credits include revenues earned from all metals other than the primary metal produced at each unit. As depicted in the tables below, by-product credits comprise an essential element of our silver unit cost structure, distinguishing our silver operations due to the polymetallic nature of their orebodies.
In addition to the uses described above, Cash Cost, After By-product Credits, per Ounce and AISC, After By-product Credits, per Ounce provide management and investors an indication of operating cash flow, after consideration of the average price, received from production. We also use these measurements for the comparative monitoring of performance of our mining operations period-to-period from a cash flow perspective.
The Casa Berardi information below reports Cash Cost, After By-product Credits, per Gold Ounce and AISC, After By-product Credits, per Gold Ounce for the production of gold, their primary product, and by-product revenues earned from silver, which is a by-product at Casa Berardi. Only costs and ounces produced relating to units with the same primary product are combined to represent Cash Cost, After By-product Credits, per Ounce and AISC, After By-product Credits, per Ounce. Thus, the gold produced at our Casa Berardi unit is not included as a by-product credit when calculating CashCost, After By-product Credits, per Silver Ounce and AISC, After By-product Credits, per Silver Ounce for the total of Greens Creek and Lucky Friday, our combined silver properties. Similarly, the silver produced at our other two units is not included as a by-product credit when calculating the gold metrics for Casa Berardi.
| In thousands (except per ounce amounts) | Three Months Ended June 30, 2024 | Three Months Ended March 31, 2024 | Six Months Ended June 30, 2024 | Six Months Ended June 30, 2023 | ||||||||||||||||||||||||||||||||||||||||||||||||||||||||||||||||||||||||
| Greens Creek | Lucky Friday | Keno Hill (4) | Corporate and other(3) | Total Silver | Greens Creek | Lucky Friday | Keno Hill (4) | Corporate and other(3) | Total Silver | Greens Creek | Lucky Friday(2) | Keno Hill (4) | Corporate and other(3) | Total Silver | Greens Creek | Lucky Friday(2) | Keno Hill (4) | Corporate and other(3) | Total Silver | |||||||||||||||||||||||||||||||||||||||||||||||||||||||||
| Total cost of sales | $ | 56,786 | $ | 37,523 | $ | 28,950 | $ | — | $ | 123,259 | $ | 69,857 | $ | 27,519 | $ | 10,847 | $ | — | $ | 108,223 | $ | 126,643 | $ | 65,042 | $ | 39,797 | $ | — | $ | 231,482 | $ | 129,342 | $ | 66,724 | $ | 1,581 | $ | — | $ | 197,647 | ||||||||||||||||||||||||||||||||||||
| Depreciation, depletion and amortization | (11,316 | ) | (10,708 | ) | (4,729 | ) | — | (26,753 | ) | (14,443 | ) | (7,911 | ) | (3,602 | ) | — | (25,956 | ) | (25,759 | ) | (18,619 | ) | (8,331 | ) | — | (52,709 | ) | (27,542 | ) | (19,435 | ) | (261 | ) | — | (47,238 | ) | ||||||||||||||||||||||||||||||||||||||||
| Treatment costs | 6,069 | 2,746 | – | — | 8,815 | 9,724 | 3,223 | — | — | 12,947 | 15,793 | 5,969 | – | — | 21,762 | 20,745 | 9,464 | 113 | — | 30,322 | ||||||||||||||||||||||||||||||||||||||||||||||||||||||||
| Change in product inventory | 7,296 | (115 | ) | — | — | 7,181 | (2,196 | ) | 611 | — | — | (1,585 | ) | 5,100 | 496 | — | — | 5,596 | (2,856 | ) | (863 | ) | — | — | (3,719 | ) | ||||||||||||||||||||||||||||||||||||||||||||||||||
| Reclamation and other costs | (882 | ) | (311 | ) | — | — | (1,193 | ) | (655 | ) | (102 | ) | — | — | (757 | ) | (1,537 | ) | (413 | ) | — | — | (1,950 | ) | 134 | (658 | ) | — | — | (524 | ) | |||||||||||||||||||||||||||||||||||||||||||||
| Exclusion of Lucky Friday cash costs (5) | — | — | — | — | — | — | (3,634 | ) | — | — | (3,634 | ) | – | (3,634 | ) | — | — | (3,634 | ) | — | — | — | — | — | ||||||||||||||||||||||||||||||||||||||||||||||||||||
| Exclusion of Keno Hill cash costs (4) | — | — | (24,221 | ) | — | (24,221 | ) | — | — | (7,245 | ) | — | (7,245 | ) | – | – | (31,466 | ) | — | (31,466 | ) | — | — | (1,433 | ) | — | (1,433 | ) | ||||||||||||||||||||||||||||||||||||||||||||||||
| Cash Cost, Before By-product Credits (1) | 57,953 | 29,135 | — | — | 87,088 | 62,287 | 19,706 | — | — | 81,993 | 120,240 | 48,841 | — | — | 169,081 | 119,823 | 55,232 | — | — | 175,055 | ||||||||||||||||||||||||||||||||||||||||||||||||||||||||
| Reclamation and other costs | 785 | 183 | — | — | 968 | 785 | 222 | — | — | 1,007 | 1,570 | 405 | — | — | 1,975 | 1,444 | 570 | — | — | 2,014 | ||||||||||||||||||||||||||||||||||||||||||||||||||||||||
| Sustaining capital | 10,911 | 9,517 | — | 1,035 | 21,463 | 8,416 | 12,051 | — | 66 | 20,533 | 19,327 | 21,568 | — | 1,101 | 41,996 | 15,355 | 16,865 | — | 594 | 32,814 | ||||||||||||||||||||||||||||||||||||||||||||||||||||||||
| Exclusion of Lucky Friday sustaining costs (5) | — | — | — | — | — | — | (5,396 | ) | — | — | (5,396 | ) | — | (5,396 | ) | — | — | (5,396 | ) | — | — | — | — | — | ||||||||||||||||||||||||||||||||||||||||||||||||||||
| General and administrative | — | — | — | 14,740 | 14,740 | — | — | — | 11,216 | 11,216 | — | — | — | 25,956 | 25,956 | — | — | — | 22,853 | 22,853 | ||||||||||||||||||||||||||||||||||||||||||||||||||||||||
| AISC, Before By-product Credits (1) | 69,649 | 38,835 | — | 15,775 | 124,259 | 71,488 | 26,583 | — | 11,282 | 109,353 | 141,137 | 65,418 | — | 27,057 | 233,612 | 136,622 | 72,667 | — | 23,447 | 232,736 | ||||||||||||||||||||||||||||||||||||||||||||||||||||||||
| By-product credits: | ||||||||||||||||||||||||||||||||||||||||||||||||||||||||||||||||||||||||||||
| Zinc | (21,873 | ) | (6,706 | ) | — | — | (28,579 | ) | (20,206 | ) | (4,785 | ) | — | — | (24,991 | ) | (42,079 | ) | (11,491 | ) | — | — | (53,570 | ) | (44,928 | ) | (12,264 | ) | — | — | (57,192 | ) | ||||||||||||||||||||||||||||||||||||||||||||
| Gold | (28,844 | ) | — | — | — | (28,844 | ) | (26,551 | ) | — | — | — | (26,551 | ) | (55,395 | ) | – | — | — | (55,395 | ) | (53,744 | ) | — | — | — | (53,744 | ) | ||||||||||||||||||||||||||||||||||||||||||||||||
| Lead | (6,818 | ) | (15,466 | ) | — | — | (22,284 | ) | (6,980 | ) | (11,720 | ) | — | — | (18,700 | ) | (13,799 | ) | (27,187 | ) | — | — | (40,986 | ) | (14,802 | ) | (28,586 | ) | — | — | (43,388 | ) | ||||||||||||||||||||||||||||||||||||||||||||
| Exclusion of Lucky Friday byproduct credits (5) | — | — | — | — | — | — | 3,943 | — | — | 3,943 | — | 3,943 | — | — | 3,943 | — | — | — | — | — | ||||||||||||||||||||||||||||||||||||||||||||||||||||||||
| Total By-product credits | (57,535 | ) | (22,172 | ) | — | — | (79,707 | ) | (53,737 | ) | (12,562 | ) | — | — | (66,299 | ) | (111,273 | ) | (34,735 | ) | — | — | (146,008 | ) | (113,474 | ) | (40,850 | ) | — | — | (154,324 | ) | ||||||||||||||||||||||||||||||||||||||||||||
| Cash Cost, After By-product Credits | $ | 418 | $ | 6,963 | $ | — | $ | — | $ | 7,381 | $ | 8,550 | $ | 7,144 | $ | — | $ | — | $ | 15,694 | $ | 8,967 | $ | 14,106 | $ | — | $ | — | $ | 23,073 | $ | 6,349 | $ | 14,382 | $ | — | $ | — | $ | 20,731 | ||||||||||||||||||||||||||||||||||||
| AISC, After By-product Credits | $ | 12,114 | $ | 16,663 | $ | — | $ | 15,775 | $ | 44,552 | $ | 17,751 | $ | 14,021 | $ | — | $ | 11,282 | $ | 43,054 | $ | 29,864 | $ | 30,683 | $ | — | $ | 27,057 | $ | 87,604 | $ | 23,148 | $ | 31,817 | $ | — | $ | 23,447 | $ | 78,412 | ||||||||||||||||||||||||||||||||||||
| Ounces produced | 2,244 | 1,308 | 3,552 | 2,479 | 1,061 | 3,540 | 4,722 | 2,369 | 7,091 | 5,129 | 2,549 | 7,678 | ||||||||||||||||||||||||||||||||||||||||||||||||||||||||||||||||
| Exclusion of Lucky Friday ounces produced (5) | — | 0 | — | — | (253 | ) | (253 | ) | — | (253 | ) | (253 | ) | — | — | — | ||||||||||||||||||||||||||||||||||||||||||||||||||||||||||||
| Divided by ounces produced | 2,244 | 1,308 | 3,552 | 2,479 | 808 | 3,287 | 4,722 | 2,116 | 6,838 | 5,129 | 2,549 | 7,678 | ||||||||||||||||||||||||||||||||||||||||||||||||||||||||||||||||
| Cash Cost, Before By-product Credits, per Silver Ounce | $ | 25.83 | $ | 22.27 | $ | 24.52 | $ | 25.13 | $ | 24.41 | $ | 24.95 | $ | 25.46 | $ | 23.08 | $ | 24.73 | $ | 23.36 | $ | 21.67 | $ | 22.80 | ||||||||||||||||||||||||||||||||||||||||||||||||||||
| By-product credits per ounce | (25.64 | ) | (16.95 | ) | (22.44 | ) | (21.68 | ) | (15.56 | ) | (20.17 | ) | (23.56 | ) | (16.41 | ) | (21.35 | ) | (22.13 | ) | (16.03 | ) | (20.10 | ) | ||||||||||||||||||||||||||||||||||||||||||||||||||||
| Cash Cost, After By-product Credits, per Silver Ounce | $ | 0.19 | $ | 5.32 | $ | 2.08 | $ | 3.45 | $ | 8.85 | $ | 4.78 | $ | 1.90 | $ | 6.67 | $ | 3.38 | $ | 1.23 | $ | 5.64 | $ | 2.70 | ||||||||||||||||||||||||||||||||||||||||||||||||||||
| AISC, Before By-product Credits, per Silver Ounce | $ | 31.04 | $ | 29.69 | $ | 34.98 | $ | 28.84 | $ | 32.92 | $ | 33.27 | $ | 29.89 | $ | 30.91 | $ | 34.16 | $ | 26.64 | $ | 28.51 | $ | 30.31 | ||||||||||||||||||||||||||||||||||||||||||||||||||||
| By-product credits per ounce | (25.64 | ) | (16.95 | ) | (22.44 | ) | (21.68 | ) | (15.56 | ) | (20.17 | ) | (23.56 | ) | (16.41 | ) | (21.35 | ) | (22.13 | ) | (16.03 | ) | (20.10 | ) | ||||||||||||||||||||||||||||||||||||||||||||||||||||
| AISC, After By-product Credits, per Silver Ounce | $ | 5.40 | $ | 12.74 | $ | 12.54 | $ | 7.16 | $ | 17.36 | $ | 13.10 | $ | 6.33 | $ | 14.50 | $ | 12.81 | $ | 4.51 | $ | 12.48 | $ | 10.21 |
| In thousands (except per ounce amounts) | Three Months Ended June 30, 2024 | Three Months Ended March 31, 2024 | Six Months Ended June 30, 2024 | Six Months Ended June 30, 2023 | ||||||||||||||||||||||||||||||||||||||||||||
| Casa Berardi | Other (3) | Total Gold and Other | Casa Berardi | Other (3) | Total Gold and Other | Casa Berardi | Other (3) | Total Gold and Other | Casa Berardi | Other (3) | Total Gold and Other | |||||||||||||||||||||||||||||||||||||
| Total cost of sales | $ | 67,340 | $ | 3,628 | $ | 70,968 | $ | 58,260 | $ | 3,885 | $ | 62,145 | $ | 125,600 | $ | 7,513 | $ | 133,113 | $ | 105,574 | $ | 1,803 | $ | 107,377 | ||||||||||||||||||||||||
| Depreciation, depletion and amortization | (27,010 | ) | — | (27,010 | ) | (22,951 | ) | — | (22,951 | ) | (49,961 | ) | — | (49,961 | ) | (24,308 | ) | (174 | ) | (24,482 | ) | |||||||||||||||||||||||||||
| Treatment costs | 52 | — | 52 | 24 | — | 24 | 76 | — | 76 | 818 | — | 818 | ||||||||||||||||||||||||||||||||||||
| Change in product inventory | (550 | ) | — | (550 | ) | 1,739 | — | 1,739 | 1,189 | — | 1,189 | (3,368 | ) | — | (3,368 | ) | ||||||||||||||||||||||||||||||||
| Reclamation and other costs | (206 | ) | — | (206 | ) | (209 | ) | — | (209 | ) | (415 | ) | — | (415 | ) | (436 | ) | — | (436 | ) | ||||||||||||||||||||||||||||
| Exclusion of Other Costs | — | (3,628 | ) | (3,628 | ) | — | (3,885 | ) | (3,885 | ) | — | (7,513 | ) | (7,513 | ) | (2,851 | ) | (1,629 | ) | (4,480 | ) | |||||||||||||||||||||||||||
| Cash Cost, Before By-product Credits (1) | 39,626 | — | 39,626 | 36,863 | — | 36,863 | 76,489 | — | 76,489 | 75,429 | — | 75,429 | ||||||||||||||||||||||||||||||||||||
| Reclamation and other costs | 206 | 206 | 209 | 209 | 415 | 415 | 436 | 436 | ||||||||||||||||||||||||||||||||||||||||
| Sustaining capital | 2,667 | — | 2,667 | 4,861 | — | 4,861 | 7,528 | — | 7,528 | 24,041 | — | 24,041 | ||||||||||||||||||||||||||||||||||||
| AISC, Before By-product Credits (1) | 42,499 | — | 42,499 | 41,933 | — | 41,933 | 84,432 | — | 84,432 | 99,906 | — | 99,906 | ||||||||||||||||||||||||||||||||||||
| By-product credits: | ||||||||||||||||||||||||||||||||||||||||||||||||
| Silver | (183 | ) | — | (183 | ) | (143 | ) | — | (143 | ) | (326 | ) | — | (326 | ) | (271 | ) | — | (271 | ) | ||||||||||||||||||||||||||||
| Total By-product credits | (183 | ) | — | (183 | ) | (143 | ) | — | (143 | ) | (326 | ) | — | (326 | ) | (271 | ) | — | (271 | ) | ||||||||||||||||||||||||||||
| Cash Cost, After By-product Credits | $ | 39,443 | $ | — | $ | 39,443 | $ | 36,720 | $ | — | $ | 36,720 | $ | 76,163 | $ | — | $ | 76,163 | $ | 75,158 | $ | — | $ | 75,158 | ||||||||||||||||||||||||
| AISC, After By-product Credits | $ | 42,316 | $ | — | $ | 42,316 | $ | 41,790 | $ | — | $ | 41,790 | $ | 84,106 | $ | — | $ | 84,106 | $ | 99,635 | $ | — | $ | 99,635 | ||||||||||||||||||||||||
| Divided by gold ounces produced | 23 | — | 23 | 22 | — | 22 | 45 | — | 45 | 44 | 44 | |||||||||||||||||||||||||||||||||||||
| Cash Cost, Before By-product Credits, per Gold Ounce | $ | 1,709 | $ | — | $ | 1,709 | $ | 1,675 | $ | — | $ | 1,675 | $ | 1,692 | $ | — | $ | 1,692 | $ | 1,731 | $ | — | $ | 1,731 | ||||||||||||||||||||||||
| By-product credits per ounce | (8 | ) | — | (8 | ) | (6 | ) | — | (6 | ) | (7 | ) | — | (7 | ) | (6 | ) | — | (6 | ) | ||||||||||||||||||||||||||||
| Cash Cost, After By-product Credits, per Gold Ounce | $ | 1,701 | $ | — | $ | 1,701 | $ | 1,669 | $ | — | $ | 1,669 | $ | 1,685 | $ | — | $ | 1,685 | $ | 1,725 | $ | — | $ | 1,725 | ||||||||||||||||||||||||
| AISC, Before By-product Credits, per Gold Ounce | $ | 1,833 | $ | — | $ | 1,833 | $ | 1,905 | $ | — | $ | 1,905 | $ | 1,868 | $ | — | $ | 1,868 | $ | 2,292 | $ | — | $ | 2,292 | ||||||||||||||||||||||||
| By-product credits per ounce | (8 | ) | — | (8 | ) | (6 | ) | — | (6 | ) | (7 | ) | — | (7 | ) | (6 | ) | — | (6 | ) | ||||||||||||||||||||||||||||
| AISC, After By-product Credits, per Gold Ounce | $ | 1,825 | $ | — | $ | 1,825 | $ | 1,899 | $ | — | $ | 1,899 | $ | 1,861 | $ | — | $ | 1,861 | $ | 2,286 | $ | — | $ | 2,286 |
| In thousands (except per ounce amounts) | Three Months Ended June 30, 2024 | Three Months Ended March 31, 2024 | Six Months Ended June 30, 2024 | Six Months Ended June 30, 2023 | ||||||||||||||||||||||||||||||||||||||||||||
| Total Silver | Total Gold and Other | Total | Total Silver | Total Gold and Other | Total | Total Silver | Total Gold and Other | Total | Total Silver | Total Gold and Other | Total | |||||||||||||||||||||||||||||||||||||
| Total cost of sales | $ | 123,259 | $ | 70,968 | $ | 194,227 | $ | 108,223 | $ | 62,145 | $ | 170,368 | $ | 231,482 | $ | 133,113 | $ | 364,595 | $ | 197,647 | $ | 107,377 | $ | 305,024 | ||||||||||||||||||||||||
| Depreciation, depletion and amortization | (26,753 | ) | (27,010 | ) | (53,763 | ) | (25,956 | ) | (22,951 | ) | (48,907 | ) | (52,709 | ) | (49,961 | ) | (102,670 | ) | (47,238 | ) | (24,482 | ) | (71,720 | ) | ||||||||||||||||||||||||
| Treatment costs | 8,815 | 52 | 8,867 | 12,947 | 24 | 12,971 | 21,762 | 76 | 21,838 | 30,322 | 818 | 31,140 | ||||||||||||||||||||||||||||||||||||
| Change in product inventory | 7,181 | (550 | ) | 6,631 | (1,585 | ) | 1,739 | 154 | 5,596 | 1,189 | 6,785 | (3,719 | ) | (3,368 | ) | (7,087 | ) | |||||||||||||||||||||||||||||||
| Reclamation and other costs | (1,193 | ) | (206 | ) | (1,399 | ) | (757 | ) | (209 | ) | (966 | ) | (1,950 | ) | (415 | ) | (2,365 | ) | (524 | ) | (436 | ) | (960 | ) | ||||||||||||||||||||||||
| Exclusion of Lucky Friday cash costs (5) | — | — | — | (3,634 | ) | — | (3,634 | ) | (3,634 | ) | — | (3,634 | ) | (1,433 | ) | — | (1,433 | ) | ||||||||||||||||||||||||||||||
| Exclusion of Keno Hill cash costs (4) | (24,221 | ) | — | (24,221 | ) | (7,245 | ) | — | (7,245 | ) | (31,466 | ) | — | (31,466 | ) | — | — | — | ||||||||||||||||||||||||||||||
| Exclusion of Other costs | — | (3,628 | ) | (3,628 | ) | — | (3,885 | ) | (3,885 | ) | — | (7,513 | ) | (7,513 | ) | — | (4,480 | ) | (4,480 | ) | ||||||||||||||||||||||||||||
| Cash Cost, Before By-product Credits (1) | 87,088 | 39,626 | 126,714 | 81,993 | 36,863 | 118,856 | 169,081 | 76,489 | 245,570 | 175,055 | 75,429 | 250,484 | ||||||||||||||||||||||||||||||||||||
| Reclamation and other costs | 968 | 206 | 1,174 | 1,007 | 209 | 1,216 | 1,975 | 415 | 2,390 | 2,014 | 436 | 2,450 | ||||||||||||||||||||||||||||||||||||
| Sustaining capital | 21,463 | 2,667 | 24,130 | 20,533 | 4,861 | 25,394 | 41,996 | 7,528 | 49,524 | 32,814 | 24,041 | 56,855 | ||||||||||||||||||||||||||||||||||||
| Exclusion of Lucky Friday sustaining costs (5) | — | — | — | (5,396 | ) | — | (5,396 | ) | (5,396 | ) | — | (5,396 | ) | — | — | — | ||||||||||||||||||||||||||||||||
| General and administrative | 14,740 | — | 14,740 | 11,216 | — | 11,216 | 25,956 | — | 25,956 | 22,853 | — | 22,853 | ||||||||||||||||||||||||||||||||||||
| AISC, Before By-product Credits (1) | 124,259 | 42,499 | 166,758 | 109,353 | 41,933 | 151,286 | 233,612 | 84,432 | 318,044 | 232,736 | 99,906 | 332,642 | ||||||||||||||||||||||||||||||||||||
| By-product credits: | ||||||||||||||||||||||||||||||||||||||||||||||||
| Zinc | (28,579 | ) | — | (28,579 | ) | (24,991 | ) | — | (24,991 | ) | (53,570 | ) | — | (53,570 | ) | (57,192 | ) | — | (57,192 | ) | ||||||||||||||||||||||||||||
| Gold | (28,844 | ) | — | (28,844 | ) | (26,551 | ) | — | (26,551 | ) | (55,395 | ) | — | (55,395 | ) | (53,744 | ) | — | (53,744 | ) | ||||||||||||||||||||||||||||
| Lead | (22,284 | ) | — | (22,284 | ) | (18,700 | ) | — | (18,700 | ) | (40,986 | ) | — | (40,986 | ) | (43,388 | ) | — | (43,388 | ) | ||||||||||||||||||||||||||||
| Silver | — | (183 | ) | (183 | ) | — | (143 | ) | (143 | ) | — | (326 | ) | (326 | ) | — | (271 | ) | (271 | ) | ||||||||||||||||||||||||||||
| Exclusion of Lucky Friday by-product credits (5) | — | — | — | 3,943 | — | 3,943 | 3,943 | — | 3,943 | — | — | — | ||||||||||||||||||||||||||||||||||||
| Total By-product credits | (79,707 | ) | (183 | ) | (79,890 | ) | (66,299 | ) | (143 | ) | (66,442 | ) | (146,008 | ) | (326 | ) | (146,334 | ) | (154,324 | ) | (271 | ) | (154,595 | ) | ||||||||||||||||||||||||
| Cash Cost, After By-product Credits | $ | 7,381 | $ | 39,443 | $ | 46,824 | $ | 15,694 | $ | 36,720 | $ | 52,414 | $ | 23,073 | $ | 76,163 | $ | 99,236 | $ | 20,731 | $ | 75,158 | $ | 95,889 | ||||||||||||||||||||||||
| AISC, After By-product Credits | $ | 44,552 | $ | 42,316 | $ | 86,868 | $ | 43,054 | $ | 41,790 | $ | 84,844 | $ | 87,604 | $ | 84,106 | $ | 171,710 | $ | 78,412 | $ | 99,635 | $ | 178,047 | ||||||||||||||||||||||||
| Ounces produced | 3,552 | 23 | 3,540 | 22 | 7,091 | 45 | 7,678 | 44 | ||||||||||||||||||||||||||||||||||||||||
| Exclusion of Lucky Friday ounces produced (5) | — | — | (253 | ) | — | (253 | ) | — | — | — | ||||||||||||||||||||||||||||||||||||||
| Divided by ounces produced | 3,552 | 23 | 3,287 | 22 | 6,838 | 45 | 7,678 | 44 | ||||||||||||||||||||||||||||||||||||||||
| Cash Cost, Before By-product Credits, per Ounce | $ | 24.52 | $ | 1,709 | $ | 24.95 | $ | 1,675 | $ | 24.73 | $ | 1,692 | $ | 22.80 | $ | 1,731 | ||||||||||||||||||||||||||||||||
| By-product credits per ounce | (22.44 | ) | (8 | ) | (20.17 | ) | (6 | ) | (21.35 | ) | (7 | ) | (20.10 | ) | (6 | ) | ||||||||||||||||||||||||||||||||
| Cash Cost, After By-product Credits, per Ounce | $ | 2.08 | $ | 1,701 | $ | 4.78 | $ | 1,669 | $ | 3.38 | $ | 1,685 | $ | 2.70 | $ | 1,725 | ||||||||||||||||||||||||||||||||
| AISC, Before By-product Credits, per Ounce | $ | 34.98 | $ | 1,833 | $ | 33.27 | $ | 1,905 | $ | 34.16 | $ | 1,868 | $ | 30.31 | $ | 2,292 | ||||||||||||||||||||||||||||||||
| By-product credits per ounce | (22.44 | ) | (8 | ) | (20.17 | ) | (6 | ) | (21.35 | ) | (7 | ) | (20.10 | ) | (6 | ) | ||||||||||||||||||||||||||||||||
| AISC, After By-product Credits, per Ounce | $ | 12.54 | 1,825 | $ | 13.10 | 1,899 | $ | 12.81 | 1,861 | $ | 10.21 | 2,286 |
| In thousands (except per ounce amounts) | Three Months Ended December 31, 2023 | Three Months Ended September 30, 2023 | Three Months Ended June 30, 2023 | |||||||||||||||||||||||||||||||||||||||||||||||||||||
| Greens Creek | Lucky Friday | Keno Hill (4) | Corporate (2) | Total Silver | Greens Creek | Lucky Friday | Keno Hill (4) | Corporate (2) | Total Silver | Greens Creek | Lucky Friday | Keno Hill | Corporate (2) | Total Silver | ||||||||||||||||||||||||||||||||||||||||||
| Total cost of sales | $ | 70,231 | $ | 3,117 | $ | 17,936 | $ | — | $ | 91,284 | $ | 60,322 | $ | 14,344 | $ | 16,001 | $ | — | $ | 90,667 | $ | 63,054 | $ | 32,190 | $ | 1,581 | $ | — | $ | 96,825 | ||||||||||||||||||||||||||
| Depreciation, depletion and amortization | (15,438 | ) | (584 | ) | (2,068 | ) | — | (18,090 | ) | (11,015 | ) | (4,306 | ) | (1,948 | ) | — | (17,269 | ) | (13,078 | ) | (8,979 | ) | (261 | ) | — | (22,318 | ) | |||||||||||||||||||||||||||||
| Treatment costs | 9,873 | 149 | (76 | ) | — | 9,946 | 10,369 | 1,368 | 1,033 | — | 12,770 | 10,376 | 4,187 | 113 | — | 14,676 | ||||||||||||||||||||||||||||||||||||||||
| Change in product inventory | (1,787 | ) | (1,851 | ) | — | — | (3,638 | ) | 377 | (2,450 | ) | — | — | (2,073 | ) | (1,242 | ) | 1,546 | — | — | 304 | |||||||||||||||||||||||||||||||||||
| Reclamation and other costs | (534 | ) | — | — | — | (534 | ) | (348 | ) | (168 | ) | — | — | (516 | ) | 263 | (250 | ) | — | — | 13 | |||||||||||||||||||||||||||||||||||
| Exclusion of Lucky Friday cash costs (5) | — | (831 | ) | — | — | (831 | ) | — | (20 | ) | — | — | (20 | ) | — | — | — | — | — | |||||||||||||||||||||||||||||||||||||
| Exclusion of Keno Hill cash costs (4) | — | — | (15,792 | ) | — | (15,792 | ) | — | — | (15,086 | ) | — | (15,086 | ) | — | — | (1,433 | ) | — | (1,433 | ) | |||||||||||||||||||||||||||||||||||
| Cash Cost, Before By-product Credits (1) | 62,345 | — | — | — | 62,345 | 59,705 | 8,768 | — | — | 68,473 | 59,373 | 28,694 | — | — | 88,067 | |||||||||||||||||||||||||||||||||||||||||
| Reclamation and other costs | 723 | — | — | — | 723 | 722 | 101 | — | — | 823 | 722 | 285 | — | — | 1,007 | |||||||||||||||||||||||||||||||||||||||||
| Sustaining capital | 15,249 | 14,768 | — | 97 | 30,114 | 11,330 | 7,386 | — | 237 | 18,953 | 8,714 | 9,081 | — | 688 | 18,483 | |||||||||||||||||||||||||||||||||||||||||
| Exclusion of Lucky Friday sustaining costs (5) | — | (14,768 | ) | — | (14,768 | ) | — | (4,934 | ) | (4,934 | ) | — | — | — | — | — | ||||||||||||||||||||||||||||||||||||||||
| General and administrative | — | — | — | 12,273 | 12,273 | — | — | — | 7,596 | 7,596 | — | — | — | 10,783 | 10,783 | |||||||||||||||||||||||||||||||||||||||||
| AISC, Before By-product Credits (1) | 78,317 | — | — | 12,370 | 90,687 | 71,757 | 11,321 | — | 7,833 | 90,911 | 68,809 | 38,060 | — | 11,471 | 118,340 | |||||||||||||||||||||||||||||||||||||||||
| By-product credits: | ||||||||||||||||||||||||||||||||||||||||||||||||||||||||
| Zinc | (18,499 | ) | (223 | ) | — | — | (18,722 | ) | (20,027 | ) | (2,019 | ) | — | — | (22,046 | ) | (20,923 | ) | (5,448 | ) | — | — | (26,371 | ) | ||||||||||||||||||||||||||||||||
| Gold | (25,418 | ) | — | — | — | (25,418 | ) | (25,344 | ) | — | — | — | (25,344 | ) | (28,458 | ) | — | — | — | (28,458 | ) | |||||||||||||||||||||||||||||||||||
| Lead | (7,282 | ) | (667 | ) | — | — | (7,949 | ) | (7,201 | ) | (5,368 | ) | — | — | (12,569 | ) | (6,860 | ) | (14,287 | ) | — | — | (21,147 | ) | ||||||||||||||||||||||||||||||||
| Exclusion of Lucky Friday byproduct credits (5) | — | 890 | 890 | — | 676 | 676 | — | — | — | — | — | |||||||||||||||||||||||||||||||||||||||||||||
| Total By-product credits | (51,199 | ) | — | — | — | (51,199 | ) | (52,572 | ) | (6,711 | ) | — | — | (59,283 | ) | (56,241 | ) | (19,735 | ) | — | — | (75,976 | ) | |||||||||||||||||||||||||||||||||
| Cash Cost, After By-product Credits | $ | 11,146 | $ | — | $ | — | $ | — | $ | 11,146 | $ | 7,133 | $ | 2,057 | $ | — | $ | — | $ | 9,190 | $ | 3,132 | $ | 8,959 | $ | — | $ | — | $ | 12,091 | ||||||||||||||||||||||||||
| AISC, After By-product Credits | $ | 27,118 | $ | — | $ | — | $ | 12,370 | $ | 39,488 | $ | 19,185 | $ | 4,610 | $ | — | $ | 7,833 | $ | 31,628 | $ | 12,568 | $ | 18,325 | $ | — | $ | 11,471 | $ | 42,364 | ||||||||||||||||||||||||||
| Ounces produced | 2,260 | 62 | 2,322 | 2,343 | 475 | 2,818 | 2,356 | 1,287 | 3,643 | |||||||||||||||||||||||||||||||||||||||||||||||
| Exclusion of Lucky Friday ounces produced (5) | — | (62 | ) | (62 | ) | — | (41 | ) | (41 | ) | — | — | — | |||||||||||||||||||||||||||||||||||||||||||
| Divided by ounces produced | 2,260 | — | 2,260 | 2,343 | 434 | 2,777 | 2,356 | 1,287 | 3,643 | |||||||||||||||||||||||||||||||||||||||||||||||
| Cash Cost, Before By-product Credits, per Silver Ounce | $ | 27.59 | N/A | $ | 27.59 | $ | 25.48 | $ | 20.20 | $ | 24.66 | $ | 25.20 | $ | 22.30 | $ | 24.18 | |||||||||||||||||||||||||||||||||||||||
| By-product credits per ounce | (22.65 | ) | N/A | (22.65 | ) | (22.44 | ) | (15.46 | ) | (21.35 | ) | (23.87 | ) | (15.34 | ) | (20.86 | ) | |||||||||||||||||||||||||||||||||||||||
| Cash Cost, After By-product Credits, per Silver Ounce | $ | 4.94 | N/A | $ | 4.94 | $ | 3.04 | $ | 4.74 | $ | 3.31 | $ | 1.33 | $ | 6.96 | $ | 3.33 | |||||||||||||||||||||||||||||||||||||||
| AISC, Before By-product Credits, per Silver Ounce | $ | 34.65 | N/A | $ | 40.13 | $ | 30.62 | $ | 26.09 | $ | 32.74 | $ | 29.21 | $ | 29.58 | $ | 32.49 | |||||||||||||||||||||||||||||||||||||||
| By-product credits per ounce | (22.65 | ) | N/A | (22.65 | ) | (22.44 | ) | (15.46 | ) | (21.35 | ) | (23.87 | ) | (15.34 | ) | (20.86 | ) | |||||||||||||||||||||||||||||||||||||||
| AISC, After By-product Credits, per Silver Ounce | $ | 12.00 | N/A | $ | 17.48 | $ | 8.18 | $ | 10.63 | $ | 11.39 | $ | 5.34 | $ | 14.24 | $ | 11.63 |
| In thousands (except per ounce amounts) | Three Months Ended December 31, 2023 | Three Months Ended September 30, 2023 | Three Months Ended June 30, 2023 | |||||||||||||||||||||||||||||||||
| Casa Berardi | Other (3) | Total Gold and Other | Casa Berardi | Other (3) | Total Gold and Other | Casa Berardi | Other (3) | Total Gold and Other | ||||||||||||||||||||||||||||
| Total cost of sales | $ | 58,945 | $ | 3,596 | $ | 62,541 | $ | 56,822 | $ | 940 | $ | 57,762 | $ | 42,576 | $ | 1,071 | $ | 43,647 | ||||||||||||||||||
| Depreciation, depletion and amortization | (22,749 | ) | 2 | (22,747 | ) | (18,980 | ) | 32 | (18,948 | ) | (10,272 | ) | (127 | ) | (10,399 | ) | ||||||||||||||||||||
| Treatment costs | 37 | — | 37 | 254 | — | 254 | 351 | — | 351 | |||||||||||||||||||||||||||
| Change in product inventory | 2,432 | — | 2,432 | (1,977 | ) | — | (1,977 | ) | (951 | ) | — | (951 | ) | |||||||||||||||||||||||
| Reclamation and other costs | (216 | ) | — | (216 | ) | (219 | ) | — | (219 | ) | (219 | ) | — | (219 | ) | |||||||||||||||||||||
| Exclusion of Other costs | — | (3,598 | ) | (3,598 | ) | — | (972 | ) | (972 | ) | — | (944 | ) | (944 | ) | |||||||||||||||||||||
| Cash Cost, Before By-product Credits (1) | 38,449 | — | 38,449 | 35,900 | — | 35,900 | 31,485 | — | 31,485 | |||||||||||||||||||||||||||
| Reclamation and other costs | 216 | — | 216 | 219 | — | 219 | 219 | — | 219 | |||||||||||||||||||||||||||
| Sustaining capital | 5,796 | — | 5,796 | 5,133 | — | 5,133 | 9,025 | — | 9,025 | |||||||||||||||||||||||||||
| AISC, Before By-product Credits (1) | 44,461 | — | 44,461 | 41,252 | — | 41,252 | 40,729 | — | 40,729 | |||||||||||||||||||||||||||
| By-product credits: | ||||||||||||||||||||||||||||||||||||
| Silver | (132 | ) | — | (132 | ) | (119 | ) | — | (119 | ) | (144 | ) | — | (144 | ) | |||||||||||||||||||||
| Total By-product credits | (132 | ) | — | (132 | ) | (119 | ) | — | (119 | ) | (144 | ) | — | (144 | ) | |||||||||||||||||||||
| Cash Cost, After By-product Credits | $ | 38,317 | $ | — | $ | 38,317 | $ | 35,781 | $ | — | $ | 35,781 | $ | 31,341 | $ | — | $ | 31,341 | ||||||||||||||||||
| AISC, After By-product Credits | $ | 44,329 | $ | — | $ | 44,329 | $ | 41,133 | $ | — | $ | 41,133 | $ | 40,585 | $ | — | $ | 40,585 | ||||||||||||||||||
| Divided by gold ounces produced | 23 | — | 23 | 24 | — | 24 | 19 | — | 19 | |||||||||||||||||||||||||||
| Cash Cost, Before By-product Credits, per Gold Ounce | $ | 1,708 | $ | — | $ | 1,708 | $ | 1,480 | $ | — | $ | 1,480 | $ | 1,666 | $ | — | $ | 1,666 | ||||||||||||||||||
| By-product credits per ounce | (6 | ) | — | (6 | ) | (5 | ) | — | (5 | ) | (8 | ) | — | (8 | ) | |||||||||||||||||||||
| Cash Cost, After By-product Credits, per Gold Ounce | $ | 1,702 | $ | — | $ | 1,702 | $ | 1,475 | $ | — | $ | 1,475 | $ | 1,658 | $ | — | $ | 1,658 | ||||||||||||||||||
| AISC, Before By-product Credits, per Gold Ounce | $ | 1,975 | $ | — | $ | 1,975 | $ | 1,700 | $ | — | $ | 1,700 | $ | 2,155 | $ | — | $ | 2,155 | ||||||||||||||||||
| By-product credits per ounce | (6 | ) | — | (6 | ) | (5 | ) | — | (5 | ) | (8 | ) | — | (8 | ) | |||||||||||||||||||||
| AISC, After By-product Credits, per Gold Ounce | $ | 1,969 | $ | — | $ | 1,969 | $ | 1,695 | $ | — | $ | 1,695 | $ | 2,147 | $ | — | $ | 2,147 |
| In thousands (except per ounce amounts) | Three Months Ended December 31, 2023 | Three Months Ended September 30, 2023 | Three Months Ended June 30, 2023 | |||||||||||||||||||||||||||||||||
| Total Silver | Total Gold and Other | Total | Total Silver | Total Gold and Other | Total | Total Silver | Total Gold and Other | Total | ||||||||||||||||||||||||||||
| Total cost of sales | $ | 91,284 | $ | 62,541 | $ | 153,825 | $ | 90,667 | $ | 57,762 | $ | 148,429 | $ | 96,825 | $ | 43,647 | $ | 140,472 | ||||||||||||||||||
| Depreciation, depletion and amortization | (18,090 | ) | (22,747 | ) | (40,837 | ) | (17,269 | ) | (18,948 | ) | (36,217 | ) | (22,318 | ) | (10,399 | ) | (32,717 | ) | ||||||||||||||||||
| Treatment costs | 9,946 | 37 | 9,983 | 12,770 | 254 | 13,024 | 14,676 | 351 | 15,027 | |||||||||||||||||||||||||||
| Change in product inventory | (3,638 | ) | 2,432 | (1,206 | ) | (2,073 | ) | (1,977 | ) | (4,050 | ) | 304 | (951 | ) | (647 | ) | ||||||||||||||||||||
| Reclamation and other costs | (534 | ) | (216 | ) | (750 | ) | (516 | ) | (219 | ) | (735 | ) | 13 | (219 | ) | (206 | ) | |||||||||||||||||||
| Exclusion of Lucky Friday cash costs (5) | (831 | ) | — | (831 | ) | (20 | ) | — | (20 | ) | — | — | — | |||||||||||||||||||||||
| Exclusion of Keno Hill cash costs (4) | (15,792 | ) | — | (15,792 | ) | (15,086 | ) | — | (15,086 | ) | (1,433 | ) | — | (1,433 | ) | |||||||||||||||||||||
| Exclusion of Other costs | — | (3,598 | ) | (3,598 | ) | — | (972 | ) | (972 | ) | — | (944 | ) | (944 | ) | |||||||||||||||||||||
| Cash Cost, Before By-product Credits (1) | 62,345 | 38,449 | 100,794 | 68,473 | 35,900 | 104,373 | 88,067 | 31,485 | 119,552 | |||||||||||||||||||||||||||
| Reclamation and other costs | 723 | 216 | 939 | 823 | 219 | 1,042 | 1,007 | 219 | 1,226 | |||||||||||||||||||||||||||
| Sustaining capital | 30,114 | 5,796 | 35,910 | 18,953 | 5,133 | 24,086 | 18,483 | 9,025 | 27,508 | |||||||||||||||||||||||||||
| Exclusion of Lucky Friday sustaining costs | (14,768 | ) | — | (14,768 | ) | (4,934 | ) | — | (4,934 | ) | — | — | — | |||||||||||||||||||||||
| General and administrative | 12,273 | — | 12,273 | 7,596 | — | 7,596 | 10,783 | — | 10,783 | |||||||||||||||||||||||||||
| AISC, Before By-product Credits (1) | 90,687 | 44,461 | 135,148 | 90,911 | 41,252 | 132,163 | 118,340 | 40,729 | 159,069 | |||||||||||||||||||||||||||
| By-product credits: | ||||||||||||||||||||||||||||||||||||
| Zinc | (18,722 | ) | — | (18,722 | ) | (22,046 | ) | — | (22,046 | ) | (26,371 | ) | — | (26,371 | ) | |||||||||||||||||||||
| Gold | (25,418 | ) | — | (25,418 | ) | (25,344 | ) | — | (25,344 | ) | (28,458 | ) | — | (28,458 | ) | |||||||||||||||||||||
| Lead | (7,949 | ) | — | (7,949 | ) | (12,569 | ) | — | (12,569 | ) | (21,147 | ) | — | (21,147 | ) | |||||||||||||||||||||
| Silver | — | (132 | ) | (132 | ) | 0 | (119 | ) | (119 | ) | — | (144 | ) | (144 | ) | |||||||||||||||||||||
| Exclusion of Lucky Friday byproduct credits (5) | 890 | — | 890 | 676 | — | 676 | 0 | — | — | |||||||||||||||||||||||||||
| Total By-product credits | (51,199 | ) | (132 | ) | (51,331 | ) | (59,283 | ) | (119 | ) | (59,402 | ) | (75,976 | ) | (144 | ) | (76,120 | ) | ||||||||||||||||||
| Cash Cost, After By-product Credits | $ | 11,146 | $ | 38,317 | $ | 49,463 | $ | 9,190 | $ | 35,781 | $ | 44,971 | $ | 12,091 | $ | 31,341 | $ | 43,432 | ||||||||||||||||||
| AISC, After By-product Credits | $ | 39,488 | $ | 44,329 | $ | 83,817 | $ | 31,628 | $ | 41,133 | $ | 72,761 | $ | 42,364 | $ | 40,585 | $ | 82,949 | ||||||||||||||||||
| Ounces produced | 2,322 | 23 | 2,818 | 24 | 3,643 | 19 | ||||||||||||||||||||||||||||||
| Exclusion of Lucky Friday ounces produced (5) | (62 | ) | — | (41 | ) | — | — | — | ||||||||||||||||||||||||||||
| Divided by ounces produced | 2,260 | 23 | 2,777 | 24 | ||||||||||||||||||||||||||||||||
| Cash Cost, Before By-product Credits, per Ounce | $ | 27.59 | $ | 1,708 | $ | 24.66 | 1,480 | $ | 24.18 | $ | 1,666 | |||||||||||||||||||||||||
| By-product credits per ounce | (22.65 | ) | (6 | ) | (21.35 | ) | (5 | ) | (20.86 | ) | (8 | ) | ||||||||||||||||||||||||
| Cash Cost, After By-product Credits, per Ounce | $ | 4.94 | $ | 1,702 | $ | 3.31 | $ | 1,475 | $ | 3.32 | $ | 1,658 | ||||||||||||||||||||||||
| AISC, Before By-product Credits, per Ounce | $ | 40.13 | $ | 1,975 | $ | 32.74 | $ | 1,700 | $ | 32.49 | $ | 2,155 | ||||||||||||||||||||||||
| By-product credits per ounce | (22.65 | ) | (6 | ) | (21.35 | ) | (5 | ) | (20.86 | ) | (8 | ) | ||||||||||||||||||||||||
| AISC, After By-product Credits, per Ounce | $ | 17.48 | $ | 1,969 | $ | 11.39 | $ | 1,695 | $ | 11.63 | $ | 2,147 |
| (1) | Includes all direct and indirect operating costs related to the physical activities of producing metals, including mining, processing and other plant costs, third-party refining and marketing expense, on-site general and administrative costs and royalties, before by-product revenues earned from all metals other than the primary metal produced at each operation. AISC, Before By-product Credits also includes reclamation and sustaining capital costs. | |
| (2) | AISC, Before By-product Credits for our consolidated silver properties includes corporate costs for general and administrative expense and sustaining capital. | |
| (3) | Other includes $3.6 million, $3.9 million, $3.6 million, $0.9 million, and $0.4 million of total cost of sales for the three months ended June 30, 2024, March 31, 2024, December 31, 2023, September 30, 2023, and June 30, 2023 respectively, and $7.5 million and $1.8 million for the six months ended June 30, 2024 and 2023, related to the Company’s environmental remediation services business and Nevada operations. | |
| (4) | Keno Hill is in the ramp-up phase of production and is excluded from the calculation of total cost of sales, Cash Cost, Before By-product Credits, Cash Cost, After By-product Credits, AISC, Before By-product Credits, and AISC, After By-product Credits. | |
| (5) | Lucky Friday operations were suspended in August 2023 following the underground fire in the #2 shaft secondary egress. The portion of cash costs, sustaining costs, by-product credits, and silver production incurred since the suspension are excluded from the calculation of total cost of sales, Cash Cost, Before By-product Credits, Cash Cost, After By-product Credits, AISC, Before By-product Credits, and AISC, After By-product Credits. | |
| (6) | During the three months ended March 31, 2023, the Company completed the necessary studies to conclude usage of the F-160 pit as a tailings storage facility after mining is complete. As a result, a portion of the mining costs have been excluded from Cash Cost, Before By-product Credits and AISC, Before By-product Credits. |
2024 Guidance, Previous and Current Estimates: Reconciliation of Cost of Sales to Non-GAAP Measures
| In thousands (except per ounce amounts) | Previous estimate for Twelve Months Ended December 31, 2024 | ||||||||||||||||||||||
| Greens Creek | Lucky Friday | Corporate(3) | Total Silver | Casa Berardi | Total Gold | ||||||||||||||||||
| Cost of sales and other direct production costs and depreciation, depletion and amortization | $ | 252,000 | $ | 129,400 | $ | 381,400 | $ | 205,000 | $ | 205,000 | |||||||||||||
| Depreciation, depletion and amortization | (53,000 | ) | (36,400 | ) | (89,400 | ) | (79,800 | ) | (79,800 | ) | |||||||||||||
| Treatment costs | 38,000 | 15,700 | 53,700 | 200 | 200 | ||||||||||||||||||
| Change in product inventory | 2,500 | — | 2,500 | (900 | ) | (900 | ) | ||||||||||||||||
| Reclamation and other costs | 400 | — | 400 | — | — | ||||||||||||||||||
| Cash Cost, Before By-product Credits (1) | 239,900 | 108,700 | 348,600 | 124,500 | 124,500 | ||||||||||||||||||
| Reclamation and other costs | 1,500 | 1,100 | 2,600 | 900 | 900 | ||||||||||||||||||
| Sustaining capital | 56,000 | 43,400 | 99,400 | 13,500 | 13,500 | ||||||||||||||||||
| General and administrative | – | – | 48,600 | 48,600 | — | — | |||||||||||||||||
| AISC, Before By-product Credits (1) | 297,400 | 153,200 | 48,600 | 499,200 | 138,900 | 138,900 | |||||||||||||||||
| By-product credits: | |||||||||||||||||||||||
| Zinc | (90,000 | ) | (27,300 | ) | (117,300 | ) | — | — | |||||||||||||||
| Gold | (86,000 | ) | — | (86,000 | ) | — | — | ||||||||||||||||
| Lead | (32,000 | ) | (67,400 | ) | (99,400 | ) | — | — | |||||||||||||||
| Silver | 0 | 0 | — | (400 | ) | (400 | ) | ||||||||||||||||
| Total By-product credits | (208,000 | ) | (94,700 | ) | — | (302,700 | ) | (400 | ) | (400 | ) | ||||||||||||
| Cash Cost, After By-product Credits | $ | 31,900 | $ | 14,000 | $ | — | $ | 45,900 | $ | 124,100 | $ | 124,100 | |||||||||||
| AISC, After By-product Credits | $ | 89,400 | $ | 58,500 | $ | 48,600 | $ | 196,500 | $ | 138,500 | $ | 138,500 | |||||||||||
| Divided by silver ounces produced | 9,000 | 5,100 | 14,100 | 78.5 | 78.5 | ||||||||||||||||||
| Cash Cost, Before By-product Credits, per Silver Ounce | $ | 26.66 | $ | 21.31 | $ | 24.72 | $ | 1,586 | $ | 1,586 | |||||||||||||
| By-product credits per silver ounce | (23.11 | ) | (18.57 | ) | (21.47 | ) | (5 | ) | (5 | ) | |||||||||||||
| Cash Cost, After By-product Credits, per Silver Ounce | $ | 3.54 | $ | 2.75 | $ | 3.26 | $ | 1,581 | $ | 1,581 | |||||||||||||
| AISC, Before By-product Credits, per Silver Ounce | $ | 33.04 | $ | 30.04 | $ | 35.40 | $ | 1,769 | $ | 1,769 | |||||||||||||
| By-product credits per silver ounce | (23.11 | ) | (18.57 | ) | (21.47 | ) | (5 | ) | (5 | ) | |||||||||||||
| AISC, After By-product Credits, per Silver Ounce | $ | 9.93 | $ | 11.47 | $ | 13.94 | $ | 1,764 | $ | 1,764 |
| In thousands (except per ounce amounts) | Current estimate for Twelve Months Ended December 31, 2024 | ||||||||||||||||||||||
| Greens Creek | Lucky Friday | Corporate(3) | Total Silver | Casa Berardi | Total Gold | ||||||||||||||||||
| Total cost of sales | $ | 252,000 | $ | 134,000 | $ | 386,000 | $ | 214,000 | $ | 214,000 | |||||||||||||
| Depreciation, depletion and amortization | (44,000 | ) | (38,000 | ) | (82,000 | ) | (67,000 | ) | (67,000 | ) | |||||||||||||
| Treatment costs | 28,000 | 11,000 | 39,000 | 0 | 0 | ||||||||||||||||||
| Change in product inventory | — | (2,000 | ) | (2,000 | ) | — | — | ||||||||||||||||
| Reclamation and other costs | 0 | — | — | — | — | ||||||||||||||||||
| Cash Cost, Before By-product Credits (1) | 236,000 | 105,000 | 341,000 | 147,000 | 147,000 | ||||||||||||||||||
| Reclamation and other costs | 3,000 | 1,000 | 4,000 | 1,000 | 1,000 | ||||||||||||||||||
| Sustaining capital | 51,000 | 44,000 | 1,101 | 96,101 | 16,000 | 16,000 | |||||||||||||||||
| General and administrative | – | – | 50,463 | 50,463 | — | — | |||||||||||||||||
| AISC, Before By-product Credits (1) | 290,000 | 150,000 | 51,564 | 491,564 | 164,000 | 164,000 | |||||||||||||||||
| By-product credits: | |||||||||||||||||||||||
| Zinc | (89,000 | ) | (26,000 | ) | (115,000 | ) | — | — | |||||||||||||||
| Gold | (98,000 | ) | — | (98,000 | ) | — | — | ||||||||||||||||
| Lead | (28,000 | ) | (56,000 | ) | (84,000 | ) | — | — | |||||||||||||||
| Silver | 0 | 0 | — | (600 | ) | (600 | ) | ||||||||||||||||
| Total By-product credits | (215,000 | ) | (82,000 | ) | — | (297,000 | ) | (600 | ) | (600 | ) | ||||||||||||
| Cash Cost, After By-product Credits | $ | 21,000 | $ | 23,000 | $ | — | $ | 44,000 | $ | 146,400 | $ | 146,400 | |||||||||||
| AISC, After By-product Credits | $ | 75,000 | $ | 68,000 | $ | 51,564 | $ | 194,564 | $ | 163,400 | $ | 163,400 | |||||||||||
| Divided by silver ounces produced | 9,000 | 5,150 | 14,150 | 83.5 | 83.5 | ||||||||||||||||||
| Cash Cost, Before By-product Credits, per Silver Ounce | $ | 26.22 | $ | 20.39 | $ | 24.10 | $ | 1,760 | $ | 1,760 | |||||||||||||
| By-product credits per silver ounce | (23.89 | ) | (15.92 | ) | (20.99 | ) | (7 | ) | (7 | ) | |||||||||||||
| Cash Cost, After By-product Credits, per Silver Ounce | $ | 2.33 | $ | 4.47 | $ | 3.11 | $ | 1,753 | $ | 1,753 | |||||||||||||
| AISC, Before By-product Credits, per Silver Ounce | $ | 32.22 | $ | 29.13 | $ | 34.74 | $ | 1,964 | $ | 1,964 | |||||||||||||
| By-product credits per silver ounce | (23.89 | ) | (15.92 | ) | (20.99 | ) | (7 | ) | (7 | ) | |||||||||||||
| AISC, After By-product Credits, per Silver Ounce | $ | 8.33 | $ | 13.21 | $ | 13.75 | $ | 1,957 | $ | 1,957 |
Reconciliation of Net Income (Loss) (GAAP) and Debt (GAAP) to Adjusted EBITDA (non-GAAP) and Net Debt (non-GAAP)
This release refers to the non-GAAP measures of adjusted earnings before interest, taxes, depreciation and amortization (“Adjusted EBITDA”), which is a measure of our operating performance, and net debt to adjusted EBITDA for the last 12 months (or “LTM adjusted EBITDA”), which is a measure of our ability to service our debt. Adjusted EBITDA is calculated as net income (loss) before the following items: interest expense, income and mining taxes, depreciation, depletion, and amortization expense, ramp-up and suspension costs, gains and losses on disposition of assets, foreign exchange gains and losses, fair value adjustments, net, interest and other income, provisions for environmental matters, stock-based compensation, provisional price gains and losses, monetization of zinc and lead hedges and inventory adjustments. Net debt is calculated as total debt, which consists of the liability balances for our Senior Notes, capital leases, and other notes payable, less the total of our cash and cash equivalents and short-term investments. Management believes that, when presented in conjunction with comparable GAAP measures, adjusted EBITDA and net debt to LTM adjusted EBITDA are useful to investors in evaluating our operating performance and ability to meet our debt obligations. The following table reconciles net income (loss) and debt to adjusted EBITDA and net debt:
| Dollars are in thousands | 2Q-2024 | 1Q-2024 | 4Q-2023 | 3Q-2023 | 2Q-2023 | LTM June 30, 2024 | FY 2023 | |||||||||||||||||||||
| Net income (loss) | $ | 27,870 | $ | (5,753 | ) | $ | (42,935 | ) | $ | (22,415 | ) | $ | (15,694 | ) | $ | (43,233 | ) | $ | (84,217 | ) | ||||||||
| Interest expense | 12,505 | 12,644 | 12,133 | 10,710 | 10,311 | $ | 47,992 | $ | 43,319 | |||||||||||||||||||
| Income and mining tax expense (benefit) | 9,080 | 1,815 | (5,682 | ) | (1,500 | ) | 5,162 | $ | 3,713 | $ | 1,222 | |||||||||||||||||
| Depreciation, depletion and amortization | 53,921 | 51,226 | 51,967 | 37,095 | 34,718 | 194,209 | $ | 163,672 | ||||||||||||||||||||
| Ramp-up and suspension costs | 4,272 | 12,028 | 23,814 | 21,025 | 16,323 | 61,139 | $ | 72,498 | ||||||||||||||||||||
| (Gain) loss on disposition of assets | (1,196 | ) | 69 | 1,043 | (119 | ) | (75 | ) | (203 | ) | $ | 849 | ||||||||||||||||
| Foreign exchange loss (gain) | (2,673 | ) | (3,982 | ) | 4,244 | (4,176 | ) | 3,850 | (6,587 | ) | $ | 3,810 | ||||||||||||||||
| Fair value adjustments, net | (5,002 | ) | 1,852 | (8,699 | ) | 6,397 | 2,558 | (5,452 | ) | $ | (2,925 | ) | ||||||||||||||||
| Provisional price (gains) losses | (10,937 | ) | (3,533 | ) | (5,930 | ) | (8,064 | ) | (2,143 | ) | (28,464 | ) | $ | (18,230 | ) | |||||||||||||
| Provision for closed operations and environmental matters | 1,153 | 986 | 1,164 | 2,256 | 3,111 | 5,559 | $ | 7,575 | ||||||||||||||||||||
| Stock-based compensation | 2,982 | 1,164 | 1,476 | 2,434 | 1,498 | 8,056 | $ | 6,598 | ||||||||||||||||||||
| Inventory adjustments | 2,225 | 7,671 | 4,487 | 8,814 | 2,997 | 23,197 | $ | 20,819 | ||||||||||||||||||||
| Monetization of zinc hedges | (2,125 | ) | (1,977 | ) | (3,753 | ) | (5,582 | ) | 5,467 | (13,437 | ) | $ | (4,447 | ) | ||||||||||||||
| Other | (1,180 | ) | (1,511 | ) | (422 | ) | (624 | ) | (343 | ) | (3,737 | ) | $ | (1,744 | ) | |||||||||||||
| Adjusted EBITDA | $ | 90,895 | $ | 72,699 | $ | 32,907 | $ | 46,251 | $ | 67,740 | $ | 242,752 | $ | 208,799 | ||||||||||||||
| Total debt | $ | 590,451 | $ | 662,815 | ||||||||||||||||||||||||
| Less: Cash and cash equivalents | 24,585 | 106,374 | ||||||||||||||||||||||||||
| Net debt | $ | 565,866 | $ | 556,441 | ||||||||||||||||||||||||
| Net debt/LTM adjusted EBITDA (non-GAAP) | 2.3 | 2.7 |
Reconciliation of Net Income (Loss) Applicable to Common Stockholders (GAAP) to Adjusted Net Income (Loss) Applicable to Common Shareholders (non-GAAP)
This release refers to a non-GAAP measure of adjusted net income (loss) applicable to common stockholders and adjusted net income (loss) per share, which are indicators of our performance. They exclude certain impacts which are of a nature which we believe are not reflective of our underlying performance. Management believes that adjusted net income (loss) per common share provides investors with the ability to better evaluate our underlying operating performance.
| Dollars are in thousands | 2Q-2024 | 1Q-2024 | 4Q-2023 | 3Q-2023 | 2Q-2023 | YTD- 2024 | YTD- 2023 | |||||||||||||||||||||
| Net income (loss) applicable to common stockholders | $ | 27,732 | $ | (5,891 | ) | $ | (43,073 | ) | $ | (22,553 | ) | $ | (15,832 | ) | $ | 21,841 | $ | (19,143 | ) | |||||||||
| Adjusted for items below: | ||||||||||||||||||||||||||||
| Fair value adjustments, net | (5,002 | ) | 1,852 | (8,699 | ) | 6,397 | 2,558 | (3,150 | ) | (624 | ) | |||||||||||||||||
| Provisional pricing (gains) losses | (10,937 | ) | (3,533 | ) | (5,930 | ) | (8,064 | ) | (2,143 | ) | (14,470 | ) | (4,236 | ) | ||||||||||||||
| Environmental accruals | — | — | 200 | 763 | 1,989 | 0 | 1,989 | |||||||||||||||||||||
| Foreign exchange (gain) loss | (2,673 | ) | (3,982 | ) | 4,244 | (4,176 | ) | 3,850 | (6,655 | ) | 3,742 | |||||||||||||||||
| Ramp-up and suspension costs | 4,272 | 12,028 | 23,814 | 21,025 | 16,323 | 16,300 | 27,659 | |||||||||||||||||||||
| (Gain) loss on disposition of assets | (1,196 | ) | 69 | 1,043 | (119 | ) | (75 | ) | (1,127 | ) | (75 | ) | ||||||||||||||||
| Inventory adjustments | 2,225 | 7,671 | 4,487 | 8,814 | 2,997 | 9,896 | 7,518 | |||||||||||||||||||||
| Monetization of zinc hedges | (2,125 | ) | (1,977 | ) | (3,753 | ) | (5,582 | ) | 5,467 | (4,102 | ) | 4,888 | ||||||||||||||||
| Adjusted income (loss) applicable to common stockholders | $ | 12,296 | $ | 6,237 | $ | (27,667 | ) | $ | (3,495 | ) | $ | 15,134 | $ | 18,533 | $ | 21,720 | ||||||||||||
| Weighted average shares – basic | 617,106 | 616,199 | 610,547 | 607,896 | 604,088 | 616,649 | 602,077 | |||||||||||||||||||||
| Weighted average shares – diluted | 622,206 | 616,199 | 610,547 | 607,896 | 604,088 | 621,936 | 602,077 | |||||||||||||||||||||
| Basic adjusted net income (loss) per common stock (in cents) | 0.02 | 0.01 | (0.04 | ) | (0.01 | ) | 0.03 | 0.03 | 0.04 | |||||||||||||||||||
| Diluted adjusted net income (loss) per common stock (in cents) | 0.02 | 0.01 | (0.04 | ) | (0.01 | ) | 0.03 | 0.03 | 0.04 |
Reconciliation of Cash Provided by Operating Activities (GAAP) to Free Cash Flow (non-GAAP)
This release refers to a non-GAAP measure of free cash flow, calculated as cash provided by operating activities, less additions to property, plant and mine development. Management believes that, when presented in conjunction with comparable GAAP measures, free cash flow is useful to investors in evaluating our operating performance. The following table reconciles cash provided by operating activities to free cash flow:
| Dollars are in thousands | Three Months Ended | Six Months Ended | ||||||||||||||
| June 30, 2024 | March 31, 2024 | June 30, 2024 | June 30, 2023 | |||||||||||||
| Cash provided by operating activities | $ | 78,718 | $ | 17,080 | $ | 95,798 | $ | 64,380 | ||||||||
| Less: Additions to property, plant and mine development | $ | (50,420 | ) | $ | (47,589 | ) | $ | (98,009 | ) | $ | (105,911 | ) | ||||
| Free cash flow | $ | 28,298 | $ | (30,509 | ) | $ | (2,211 | ) | $ | (41,531 | ) |
Free cash flow is a non-GAAP measure calculated as cash provided by operating activities less additions to property, plant and mine development. Cash provided by operating activities for our silver operations, the Greens Creek and Lucky Friday operating segments, excludes exploration and pre-development expense, as it is a discretionary expenditure and not a component of the mines’ operating performance.
| Dollars are in thousands | Total Silver Operations | Six Months Ended June 30, | Years Ended December 31, | |||||||||||||||||||||
| 2024 | 2023 | 2022 | 2021 | 2020 | ||||||||||||||||||||
| Cash provided by operating activities | $ | 994,371 | $ | 143,640 | $ | 214,883 | $ | 188,434 | $ | 271,309 | $ | 176,105 | ||||||||||||
| Exploration | $ | 20,888 | $ | 2,562 | $ | 7,815 | $ | 5,920 | $ | 4,591 | $ | – | ||||||||||||
| Less: Additions to property, plant and mine development | $ | (342,335 | ) | $ | (46,337 | ) | $ | (108,879 | ) | $ | (87,890 | ) | $ | (53,768 | ) | $ | (45,461 | ) | ||||||
| Free cash flow | $ | 672,924 | $ | 99,865 | $ | 113,819 | $ | 106,464 | $ | 222,132 | $ | 130,644 |
| Table A | |||||||||||
| Assay Results – Q2 2024 | |||||||||||
| Keno Hill (Yukon) | |||||||||||
| Zone | Drillhole Number | Drillhole Azm/Dip | Sample From (feet) | Sample To (feet) | True Width (feet) | Silver (oz/ton) | Gold (oz/ton) | Lead (%) | Zinc (%) | Depth From Surface (feet) | |
| Underground | Bermingham, Bear Vein | BMUG23-099 | 140/14 | 344.5 | 354.3 | 6.8 | 36.4 | 0.02 | 1.7 | 0.7 | 802 |
| Bermingham, Bear Vein | Including | 352.7 | 353.3 | 0.4 | 562.7 | 0.05 | 24.6 | 6.3 | 801 | ||
| Bermingham, Bear Vein | BMUG23-100 | 120/-21 | 269.0 | 274.0 | 2.7 | 0.1 | 0.00 | 0.0 | 0.0 | 929 | |
| Bermingham, Bear Vein | BMUG23-101 | 122/-7 | 360.0 | 362.5 | 2.2 | 0.4 | 0.00 | 0.1 | 0.2 | 929 | |
| Bermingham, Bear Vein | BMUG23-102 | 120/-26 | 297.2 | 300.2 | 1.8 | 1.3 | 0.00 | 0.0 | 2.7 | 964 | |
| Bermingham, Bear Vein | BMUG23-103 | 135/-05 | 394.9 | 403.5 | 6.5 | 6.7 | 0.00 | 1.2 | 0.2 | 920 | |
| Bermingham, Bear Vein | Including | 402.4 | 403.5 | 0.8 | 51.5 | 0.01 | 9.0 | 1.2 | 921 | ||
| Bermingham, Bear Vein | BMUG23-104 | 110/-15 | 244.4 | 251.6 | 4.1 | 0.3 | 0.00 | 0.0 | 0.2 | 891 | |
| Bermingham, Bear Vein | BMUG24-109 | 131/03 | 188.2 | 196.4 | 6.6 | 10.2 | 0.00 | 0.5 | 0.2 | 809 | |
| Bermingham, Bear Vein | Including | 188.2 | 190.3 | 1.7 | 28.7 | 0.00 | 0.7 | 0.5 | 809 | ||
| Bermingham, Bear Vein | Including | 193.2 | 193.7 | 0.4 | 39.4 | 0.00 | 5.0 | 0.1 | 809 | ||
| Bermingham, Bear Vein | BMUG24-110 | 201.8 | 218.0 | 14.1 | 10.3 | 0.00 | 1.8 | 1.8 | 820 | ||
| Bermingham, Bear Vein | Including | 207.5 | 208.4 | 0.8 | 92.2 | 0.01 | 15.2 | 24.2 | 820 | ||
| Bermingham, Bear Vein | BMUG24-112 | 134/-20 | 265.3 | 276.9 | 8.6 | 25.4 | 0.00 | 3.5 | 0.7 | 935 | |
| Bermingham, Bear Vein | Including | 265.7 | 267.1 | 1.0 | 190.6 | 0.02 | 22.4 | 3.0 | 935 | ||
| Bermingham, Bear Vein | BMUG24-113 | 145/-1 | 388.9 | 420.8 | 28.2 | 36.4 | 0.01 | 3.5 | 2.2 | 901 | |
| Bermingham, Bear Vein | Including | 388.9 | 392.1 | 2.8 | 128.2 | 0.01 | 23.2 | 1.8 | 901 | ||
| Bermingham, Bear Vein | Including | 402.2 | 414.7 | 11.0 | 51.2 | 0.00 | 2.1 | 2.3 | 903 | ||
| Bermingham, Bear Vein | BMUG24-114 | 150/-5 | 406.5 | 415.6 | 7.5 | 22.3 | 0.00 | 3.3 | 7.2 | 930 | |
| Bermingham, Bear Vein | Including | 410.6 | 413.1 | 2.1 | 41.9 | 0.00 | 5.6 | 13.6 | 931 | ||
| Bermingham, Bear Vein | BMUG24-114 | 150/-5 | 435.7 | 442.9 | 6.0 | 34.5 | 0.01 | 0.5 | 1.7 | 934 | |
| Bermingham, Bear Vein | Including | 436.4 | 438.8 | 2.0 | 84.9 | 0.01 | 1.1 | 4.2 | 935 | ||
| Bermingham, Bear Vein | BMUG24-114 | 150/-5 | 450.0 | 452.6 | 2.1 | 22.7 | 0.00 | 9.9 | 0.0 | 937 | |
| Bermingham, Bear Vein | Including | 452.1 | 452.6 | 0.4 | 133.6 | 0.01 | 59.9 | 0.1 | 937 | ||
| Bermingham, Bear Vein | BMUG24-115 | 135/-10 | 416.3 | 430.0 | 12.4 | 32.0 | 0.01 | 4.8 | 1.7 | 949 | |
| Bermingham, Bear Vein | Including | 416.3 | 426.1 | 8.8 | 37.9 | 0.01 | 6.1 | 2.1 | 949 | ||
| Bermingham, Bear Vein | BMUG24-116 | 130/-10 | 407.5 | 412.1 | 3.9 | 21.7 | 0.00 | 2.0 | 2.5 | 961 | |
| Bermingham, Bear Vein | Including | 409.0 | 410.1 | 1.0 | 46.1 | 0.01 | 1.1 | 7.5 | 961 | ||
| Bermingham, Bear Vein | BMUG24-117 | 145/-8 | 397.4 | 421.6 | 20.2 | 35.4 | 0.00 | 2.2 | 2.0 | 944 | |
| Bermingham, Bear Vein | Including | 397.4 | 401.0 | 3.0 | 150.8 | 0.01 | 9.9 | 4.8 | 944 | ||
| Bermingham, Bear Vein | Including | 410.1 | 411.2 | 0.9 | 86.3 | 0.01 | 3.9 | 0.5 | 947 | ||
| Bermingham, Bear Vein | Including | 418.3 | 418.8 | 0.4 | 139.4 | 0.01 | 16.9 | 37.5 | 948 | ||
| Bermingham, Bear Vein | BMUG24-119 | 150/-10 | 431.3 | 468.8 | 28.7 | 38.3 | 0.01 | 5.0 | 1.6 | 970 | |
| Bermingham, Bear Vein | Including | 436.4 | 437.0 | 0.5 | 246.7 | 0.04 | 9.2 | 2.4 | 971 | ||
| Bermingham, Bear Vein | Including | 439.1 | 440.0 | 0.7 | 323.2 | 0.03 | 25.9 | 12.7 | 972 | ||
| Bermingham, Bear Vein | Including | 453.8 | 454.4 | 0.5 | 288.5 | 0.05 | 22.8 | 1.5 | 975 | ||
| Bermingham, Bear Vein | BMUG24-123 | 122/-15 | 381.3 | 388.4 | 5.1 | 26.9 | 0.00 | 0.2 | 0.7 | 988 | |
| Bermingham, Bear Vein | BMUG24-124 | 135/-15 | 445.1 | 450.1 | 4.6 | 64.2 | 0.01 | 9.7 | 2.2 | 1004 | |
| Bermingham, Bear Vein | Including | 446.2 | 447.4 | 1.1 | 261.0 | 0.02 | 40.0 | 8.8 | 1004 | ||
| Bermingham, Bear Vein | BMUG24-125 | 155/-15 | 487.5 | 488.8 | 0.8 | 9.1 | 0.00 | 0.3 | 0.3 | 1033 | |
| Bermingham, Bear Vein | BMUG24-126 | 140/-15 | 429.7 | 436.0 | 4.7 | 96.9 | 0.01 | 7.9 | 0.7 | 1010 | |
| Bermingham, Bear Vein | BMUG24-127 | 120/-19 | 442.4 | 443.4 | 0.6 | 1.0 | 0.00 | 0.5 | 0.9 | 1050 | |
| Bermingham, Bear Vein | BMUG24-128 | 145/-15 | 436.0 | 447.2 | 9.2 | 24.3 | 0.01 | 3.9 | 0.6 | 1018 | |
| Bermingham, Bear Vein | Including | 436.0 | 437.2 | 1.0 | 113.2 | 0.01 | 17.0 | 5.1 | 1017 | ||
| Bermingham, Bear Vein | Including | 444.8 | 445.2 | 0.3 | 291.7 | 0.03 | 39.3 | 0.5 | 1017 | ||
| Bermingham, Bear Vein | BMUG24-130 | 180/-1 | 132.9 | 136.2 | 2.2 | 0.0 | 0.00 | 0.0 | 0.0 | 958 | |
| Bermingham, Bear Vein | BMUG24-131 | 170/-23 | 228.0 | 229.7 | 0.5 | 5.0 | 0.00 | 0.7 | 0.2 | 1053 | |
| Bermingham, Footwall Vein | BMUG23-100 | 120/-21 | 507.7 | 528.7 | 17.7 | 4.5 | 0.00 | 0.6 | 0.3 | 1034 | |
| Bermingham, Footwall Vein | Including | 507.7 | 508.7 | 0.8 | 17.8 | 0.00 | 9.9 | 0.1 | 1034 | ||
| Bermingham, Footwall Vein | Including | 524.1 | 525.1 | 0.8 | 48.6 | 0.01 | 0.1 | 3.0 | 1041 | ||
| Bermingham, Footwall Vein | BMUG24-112 | 134/-20 | 558.6 | 560.8 | 1.5 | 26.6 | 0.01 | 1.7 | 0.0 | 1040 | |
| Bermingham, Footwall Vein | Including | 558.6 | 560.1 | 1.0 | 37.5 | 0.01 | 2.4 | 0.1 | 1040 | ||
| Bermingham, Footwall Vein | BMUG24-115 | 135/-10 | 549.5 | 593.2 | 40.7 | 55.4 | 0.01 | 5.5 | 3.2 | 970 | |
| Bermingham, Footwall Vein | Including | 551.7 | 590.4 | 36.1 | 62.0 | 0.01 | 6.1 | 3.6 | 970 | ||
| Bermingham, Footwall Vein | BMUG24-116 | 130/-10 | 548.7 | 592.5 | 39.7 | 51.2 | 0.01 | 7.3 | 3.6 | 993 | |
| Bermingham, Footwall Vein | Including | 551.5 | 557.4 | 5.4 | 184.1 | 0.02 | 31.9 | 2.1 | 994 | ||
| Bermingham, Footwall Vein | Including | 565.6 | 576.8 | 10.1 | 92.1 | 0.01 | 9.9 | 9.2 | 996 | ||
| Bermingham, Footwall Vein | BMUG24-117 | 145/-8 | 554.1 | 558.1 | 3.8 | 1.4 | 0.00 | 0.2 | 0.4 | 969 | |
| Bermingham, Footwall Vein | BMUG24-124 | 135/-15 | 563.9 | 594.1 | 26.2 | 7.8 | 0.00 | 0.1 | 1.1 | 1037 | |
| Bermingham, Footwall Vein | Including | 592.0 | 592.8 | 0.8 | 183.5 | 0.03 | 0.1 | 1.7 | 1037 | ||
| Bermingham, Footwall Vein | BMUG24-128 | 597.7 | 603.7 | 5.0 | 4.7 | 0.00 | 0.1 | 0.4 | 1020 | ||
| Bermingham, Footwall Vein | BMUG24-132 | 155/-14 | 370.1 | 393.7 | 20.5 | 9.9 | 0.00 | 1.8 | 4.6 | 1079 | |
| Bermingham, Footwall Vein | Including | 391.4 | 393.7 | 2.0 | 28.3 | 0.01 | 6.1 | 16.7 | 1079 | ||
| Bermingham, Footwall Vein | BMUG24-133 | 148/-8 | 339.9 | 351.1 | 10.3 | 9.4 | 0.00 | 1.2 | 1.3 | 1030 | |
| Bermingham, Footwall Vein | Including | 344.5 | 345.3 | 0.7 | 73.2 | 0.01 | 1.7 | 13.2 | 1030 | ||
| Bermingham, Main Vein | BMUG23-097 | 145/06 | 413.9 | 425.9 | 7.7 | 10.0 | 0.01 | 0.5 | 2.0 | 844 | |
| Bermingham, Main Vein | BMUG23-098A | 120/-15 | 508.9 | 510.8 | 1.5 | 1.9 | 0.00 | 0.1 | 0.4 | 971 | |
| Bermingham, Main Vein | BMUG23-099 | 140/14 | 378.1 | 387.2 | 5.4 | 8.3 | 0.00 | 0.2 | 1.1 | 796 | |
| Bermingham, Main Vein | BMUG24-109 | 131/03 | 428.8 | 445.4 | 10.3 | 29.8 | 0.01 | 1.6 | 0.2 | 811 | |
| Bermingham, Main Vein | Including | 436.7 | 438.0 | 0.8 | 86.0 | 0.01 | 8.0 | 0.0 | 811 | ||
| Bermingham, Main Vein | Including | 440.3 | 441.8 | 0.9 | 203.9 | 0.05 | 8.4 | 0.1 | 810 | ||
| Bermingham, Main Vein | BMUG24-110 | 477.8 | 479.7 | 1.5 | 1.8 | 0.00 | 0.2 | 0.1 | 823 | ||
| Bermingham, Main Vein | BMUG24-112 | 134/-20 | 570.1 | 579.7 | 6.4 | 8.9 | 0.00 | 0.6 | 1.9 | 1045 | |
| Bermingham, Main Vein | Including | 579.1 | 579.7 | 0.4 | 72.9 | 0.01 | 7.5 | 7.1 | 1048 | ||
| Bermingham, Main Vein | BMUG24-118 | 161/1 | 341.3 | 344.5 | 2.5 | 15.0 | 0.00 | 1.7 | 0.1 | 879 | |
| Bermingham, Main Vein | BMUG24-118 | 161/1 | 361.5 | 363.8 | 1.8 | 14.4 | 0.00 | 3.2 | 3.7 | 879 | |
| Bermingham, Main Vein | BMUG24-121 | 155/-9 | 403.5 | 413.4 | 6.1 | 9.2 | 0.00 | 1.5 | 0.2 | 950 | |
| Bermingham, Main Vein | Including | 403.5 | 404.7 | 0.7 | 45.1 | 0.00 | 2.1 | 1.8 | 950 | ||
| Bermingham, Main Vein | BMUG24-122 | 155/-2 | 369.9 | 375.7 | 4.1 | 27.7 | 0.01 | 2.8 | 0.6 | 904 | |
| Bermingham, Main Vein | BMUG24-124 | 135/-15 | 730.0 | 733.9 | 3.3 | 4.9 | 0.01 | 0.2 | 1.0 | 1070 | |
| Bermingham, Main Vein | BMUG24-129 | 161/-12 | 422.0 | 442.6 | 16.9 | 21.5 | 0.02 | 0.8 | 0.6 | 1001 | |
| Bermingham, Main Vein | Including | 435.0 | 440.9 | 4.8 | 67.7 | 0.01 | 2.1 | 1.1 | 1001 | ||
| Bermingham, Main Vein | BMUG24-132 | 155/-14 | 470.8 | 511.8 | 26.4 | 10.6 | 0.00 | 2.9 | 0.7 | 1096 | |
| Bermingham, Main Vein | Including | 489.2 | 491.0 | 1.2 | 151.1 | 0.02 | 40.0 | 5.9 | 1096 | ||
| Bermingham, Main Vein | BMUG24-133 | 148/-8 | 407.2 | 409.8 | 1.6 | 1.4 | 0.00 | 0.0 | 3.4 | 1047 | |
| Flame & Moth, Vein 0 | FMUG24-040 | 325/-12 | 216.0 | 222.2 | 5.6 | 23.0 | 0.02 | 1.5 | 6.3 | 427 | |
| Flame & Moth, Vein 0 | Including | 218.8 | 222.2 | 3.1 | 38.6 | 0.03 | 2.2 | 8.9 | 427 | ||
| Flame & Moth, Vein 0 | FMUG24-046 | 260/-25 | 205.2 | 205.7 | 0.3 | 8.9 | 0.00 | 0.5 | 19.4 | 472 | |
| Flame & Moth, Vein 0 | FMUG24-050 | 295/-43 | 183.9 | 185.2 | 1.2 | 11.8 | 0.02 | 0.6 | 0.3 | 522 | |
| Flame & Moth, Vein 1 | FMUG24-043 | 250/-5 | 247.9 | 250.0 | 1.5 | 79.5 | 0.01 | 12.8 | 5.8 | 397 | |
| Flame & Moth, Vein 1 | FMUG24-046 | 260/-25 | 181.9 | 184.1 | 1.6 | 17.0 | 0.01 | 2.4 | 1.8 | 472 | |
| Flame & Moth, Vein 1 | FMUG24-047 | 238/-28 | 226.4 | 233.0 | 4.4 | 65.4 | 0.03 | 8.6 | 11.1 | 505 | |
| Flame & Moth, Vein 1 | FMUG24-048 | 334/-40 | 199.3 | 200.5 | 0.9 | 8.5 | 0.03 | 0.6 | 3.7 | 518 | |
| Flame & Moth, Vein 1 | FMUG24-049 | 272/-40 | 171.0 | 177.0 | 5.7 | 24.3 | 0.01 | 4.5 | 16.3 | 502 | |
| Flame & Moth, Vein 1 | Including | 171.0 | 173.0 | 2.0 | 50.7 | 0.01 | 8.6 | 20.2 | 502 | ||
| Flame & Moth, Vein 1 | FMUG24-050 | 295/-43 | 165.4 | 176.9 | 10.8 | 13.2 | 0.01 | 1.9 | 9.0 | 522 | |
| Flame & Moth, Vein 1 | Including | 167.7 | 168.7 | 0.9 | 34.6 | 0.02 | 2.6 | 6.0 | 522 | ||
| Flame & Moth, Vein 0 & Stockwork | FMUG24-042 | 268/-10 | 186.8 | 203.5 | 16.5 | 13.2 | 0.00 | 1.2 | 4.5 | 421 | |
| Flame & Moth, Vein 0 & Stockwork | Including | 186.8 | 190.6 | 3.8 | 32.2 | 0.01 | 1.1 | 1.1 | 421 | ||
| Flame & Moth, Vein 0 & Stockwork | FMUG24-043 | 250/-5 | 259.6 | 267.3 | 5.5 | 28.4 | 0.01 | 1.9 | 3.3 | 397 | |
| Flame & Moth, Vein 0 & Stockwork | Including | 262.6 | 264.7 | 1.5 | 59.5 | 0.01 | 1.7 | 4.8 | 397 | ||
| Flame & Moth, Vein 0 & Stockwork | FMUG24-045 | 295/-27 | 156.0 | 187.8 | 31.4 | 14.0 | 0.01 | 2.9 | 10.0 | 472 | |
| Flame & Moth, Vein 0 & Stockwork | Including | 163.0 | 165.1 | 2.1 | 36.2 | 0.03 | 4.7 | 3.5 | 472 | ||
| Flame & Moth, Vein 0 & Stockwork | Including | 178.0 | 179.1 | 1.1 | 64.7 | 0.04 | 17.9 | 16.1 | 472 | ||
| Flame & Moth, Vein 0, 1, Stockwork | FMUG24-041 | 299/-11 | 171.6 | 194.7 | 22.3 | 28.6 | 0.01 | 3.3 | 6.2 | 420 | |
| Flame & Moth, Vein 0, 1, Stockwork | Including | 171.6 | 173.4 | 1.7 | 129.8 | 0.02 | 5.7 | 6.6 | 420 | ||
| Flame & Moth, Vein 0, 1, Stockwork | Including | 187.0 | 194.7 | 7.4 | 35.1 | 0.01 | 6.6 | 10.6 | 420 | ||
| Flame & Moth, Vein 1 & Stockwork | FMUG24-042 | 268/-10 | 175.2 | 177.2 | 1.3 | 10.2 | 0.00 | 0.7 | 1.8 | 421 | |
| Flame & Moth, Vein 1 & Stockwork | FMUG24-044 | 315/-33 | 164.7 | 178.8 | 14.0 | 7.4 | 0.01 | 1.3 | 3.1 | 486 | |
| Flame & Moth, Stockwork | FMUG24-049 | 272/-40 | 185.5 | 189.6 | 3.9 | 21.2 | 0.01 | 1.6 | 3.3 | 502 | |
| Flame & Moth, Stockwork | including | 185.5 | 187.0 | 1.4 | 42.1 | 0.01 | 2.6 | 4.8 | 502 | ||
| Surface | Bermingham Deep, Main Vein | K-24-0875 | 297/-61 | 2336.5 | 2339.9 | 3.4 | 1.6 | 0.00 | 0.2 | 0.3 | 1995 |
| Bermingham Deep, Main Vein | K-24-0876 | 266/-59 | 2515.7 | 2530.7 | 14.1 | 0.1 | 0.00 | 0.0 | 0.0 | 2182 | |
| Bermingham Deep, Footwall Vein | K-24-0875 | 297/-61 | 2758.6 | 2773.8 | 12.0 | 0.6 | 0.00 | 0.1 | 0.7 | 2264 | |
| Bermingham Deep, Footwall Vein | K-24-0876 | 266/-59 | 2844.2 | 2864.6 | 13.1 | 0.6 | 0.00 | 0.3 | 0.1 | 2477 | |
| Bermingham Deep, Footwall Vein | Including | 2844.2 | 2845.0 | 0.5 | 10.7 | 0.00 | 6.7 | 0.1 | 2477 | ||
| Bermingham Deep, Townsite Vein | K-24-0875 | 297/-61 | 3002.0 | 3017.0 | 14.5 | 2.3 | 0.00 | 0.1 | 3.4 | 2461 | |
| Bermingham Deep, Townsite Vein | Including | 3011.8 | 3012.3 | 0.5 | 41.6 | 0.01 | 0.0 | 26.0 | 2461 | ||
| Bermingham Deep, Aho Vein | K-24-0875 | 297/-61 | 99.0 | 147.6 | 30.6 | 0.0 | 0.02 | 0.0 | 0.0 | 89 | |
| Bermingham Deep, Aho Vein | Including | 124.6 | 128.0 | 2.1 | 0.0 | 0.14 | 0.0 | 0.0 | 112 | ||
| Bermingham Deep, Aho Vein | K-24-0876 | 266/-59 | 2530.7 | 2550.4 | 9.5 | 0.3 | 0.01 | 0.0 | 0.0 | 2198 | |
| Bermingham Deep, Chance Vein | K-24-0875 | 297/-61 | 778.6 | 786.3 | 6.9 | 4.8 | 0.00 | 0.2 | 0.6 | 686 | |
| Bermingham, Townsite Vein 1 | K-24-0879 | 329/-73 | 1175.5 | 1178.5 | 1.9 | 4.3 | 0.00 | 0.1 | 0.4 | 1030 | |
| Bermingham, Townsite Vein 1 | K-24-0882 | 339/-65 | 1023.6 | 1034.3 | 8.3 | 0.8 | 0.00 | 0.1 | 0.4 | 837 | |
| Bermingham, Townsite Vein 2 | K-24-0879 | 329/-73 | 1281.2 | 1296.9 | 14.0 | 10.9 | 0.00 | 1.7 | 0.0 | 1119 | |
| Bermingham, Townsite Vein 2 | Including | 1292.9 | 1296.9 | 3.6 | 36.3 | 0.01 | 3.6 | 0.1 | 1119 | ||
| Bermingham, Townsite Vein 2 | K-24-0882 | 339/-65 | 1205.3 | 1206.2 | 0.7 | 0.3 | 0.00 | 0.0 | 0.1 | 961 |
| Greens Creek (Alaska) | |||||||||||
| Zone | Drill Hole Number | Drill Hole Azm/Dip | Sample From (feet) | Sample To (feet) | Est. True Width (feet) | Silver (oz/ton) | Gold (oz/ton) | Zinc (%) | Lead (%) | Depth From Mine Portal (feet) | |
| Underground | 9a | GC6236 | 242.8/6.1 | 57.2 | 79.0 | 21.4 | 17.9 | 0.03 | 10.9 | 5.0 | -81.9 |
| 9a | GC6236 | 242.8/6.1 | 92.8 | 110.3 | 9.0 | 17.5 | 0.02 | 17.0 | 9.3 | -78.6 | |
| 9a | GC6236 | 242.8/6.1 | 208.0 | 212.0 | 3.7 | 12.0 | 0.01 | 3.1 | 1.6 | -67.5 | |
| 9a | GC6248 | 223.9/16.4 | 370.3 | 372.6 | 1.7 | 4.8 | 0.02 | 24.4 | 5.8 | 14.3 | |
| 9a | GC6248 | 223.9/16.4 | 404.0 | 423.3 | 10.9 | 10.3 | 0.03 | 23.1 | 6.4 | 28.4 | |
| 9a | GC6285 | 222.6/23.7 | 372.8 | 379.0 | 6.1 | 3.8 | 0.02 | 10.3 | 3.1 | 62.0 | |
| 9a | GC6292 | 223/7.7 | 363.3 | 401.0 | 26.5 | 16.4 | 0.09 | 14.6 | 6.7 | -34.2 | |
| 9a | GC6298 | 230.9/6.2 | 144.5 | 167.0 | 6.2 | 23.1 | 0.04 | 8.6 | 6.0 | -77.0 | |
| 9a | GC6298 | 230.9/6.2 | 420.0 | 434.7 | 14.0 | 11.4 | 0.18 | 21.1 | 8.2 | -46.0 | |
| 9a | GC6299 | 230/22 | 3.0 | 7.0 | 3.9 | 21.1 | 0.02 | 8.6 | 4.4 | -84 | |
| 9a | GC6299 | 230/22 | 42.0 | 47.5 | 5.5 | 25.8 | 0.13 | 6.9 | 3.2 | -74 | |
| 9a | GC6299 | 230.3/22 | 127.0 | 129.8 | 2.2 | 21.0 | 0.07 | 20.8 | 13.6 | -42.8 | |
| 9a | GC6302 | 230.4/13.3 | 386.0 | 418.0 | 31.7 | 8.8 | 0.02 | 12.6 | 2.6 | 17.9 | |
| 9a | GC6309 | 217/14.6 | 151.7 | 170.4 | 18.7 | 3.3 | 0.09 | 16.4 | 1.6 | -46.0 | |
| 9a | GC6309 | 217/14.6 | 221.0 | 223.0 | 2.0 | 11.7 | 0.05 | 8.9 | 5.2 | -31.0 | |
| 9a | GC6312 | 243.4/24.1 | 160.0 | 162.9 | 1.1 | 5.4 | 0.21 | 5.6 | 2.0 | -31.0 | |
| 9a | GC6314 | 243.4/65.2 | 67.0 | 79.6 | 9.4 | 23.3 | 0.10 | 10.0 | 5.4 | -11.0 | |
| 9a | GC6315 | 243.4/50.1 | 40.0 | 69.0 | 28.9 | 49.5 | 0.68 | 8.5 | 4.3 | -36.0 | |
| 9a | GC6315 | 243.4/50.1 | 171.3 | 172.3 | 0.9 | 1.5 | 0.04 | 19.2 | 1.1 | 53.0 | |
| 9a | GC6318 | 225.4/22.7 | 182.0 | 196.0 | 13.9 | 5.3 | 0.08 | 9.7 | 2.7 | -14.0 | |
| 9a | GC6328 | 55.8/39.9 | 417.5 | 440.0 | 13.9 | 11.6 | 0.05 | 17.0 | 5.4 | -62.4 | |
| 9a | GC6331 | 63.5/44.9 | 417.5 | 477.0 | 51.5 | 18.0 | 0.02 | 26.0 | 13.5 | 2.2 | |
| 9a | GC6333 | 45.6/-36 | 331.0 | 343.5 | 11.9 | 12.6 | 0.03 | 8.0 | 5.1 | -225.6 | |
| 9a | GC6333 | 45.6/-36 | 358.5 | 364.0 | 5.0 | 15.7 | 0.06 | 13.7 | 7.0 | -243.6 | |
| 9a | GC6335 | 66/-33 | 366.0 | 372.0 | 5.4 | 23.6 | 0.25 | 1.6 | 0.9 | -232.0 | |
| 9a | GC6337 | 61.1/-19 | 171.0 | 173.0 | 1.7 | 15.6 | 0.01 | 11.1 | 4.9 | -91.0 | |
| 9a | GC6337 | 61.1/-19 | 271.0 | 302.3 | 27.8 | 21.8 | 0.02 | 8.5 | 3.0 | -125.0 | |
| 9a | GC6337 | 61.1/-19 | 320.0 | 324.5 | 4.0 | 5.1 | 0.03 | 5.4 | 3.2 | -129.0 | |
| 9a | GC6338 | 76.4/-37.6 | 340.2 | 345.0 | 4.6 | 15.2 | 0.26 | 20.8 | 8.6 | -241.4 | |
| 9a | GC6338 | 76.4/-37.6 | 357.4 | 371.1 | 13.1 | 20.8 | 0.25 | 14.5 | 6.9 | -253.5 | |
| 9a | GC6340 | 83.7/-35.5 | 413.4 | 417.0 | 3.6 | 15.2 | 0.03 | 7.0 | 3.6 | -272.0 | |
| 9a | GC6349 | 161/73 | 0.0 | 5.0 | 5.0 | 29.5 | 0.04 | 9.7 | 5.3 | -54 | |
| 9a | GC6361 | 243/26 | 70.5 | 79.0 | 6.4 | 10.1 | 0.06 | 23.1 | 11.2 | -53 | |
| 9a | GC6372 | 243/78 | 4.7 | 24.1 | 16.8 | 9.0 | 0.03 | 8.1 | 3.4 | -79 | |
| 9a | GC6397 | 3/-45 | 3.0 | 18.3 | 12.8 | 6.3 | 0.09 | 11.6 | 2.4 | -400 | |
| 9a | GC6403 | 268/8 | 42.0 | 51.0 | 8.7 | 5.4 | 0.12 | 14.3 | 2.1 | -359 | |
| 9a | GC6404 | 286/25 | 36.7 | 39.8 | 3.0 | 12.6 | 0.14 | 4.7 | 0.7 | -349 | |
| 200 South | GC6244 | 243.4/-42.9 | 125.0 | 134.9 | 6.0 | 10.5 | 0.05 | 3.6 | 1.4 | -1385.0 | |
| 200 South | GC6244 | 243.4/-42.9 | 170.0 | 172.8 | 1.6 | 6.4 | 0.07 | 3.2 | 1.6 | -1413.0 | |
| 200 South | GC6249 | 243.4/-63.8 | 100.0 | 105.0 | 4.4 | 0.9 | 0.01 | 9.7 | 4.8 | -1389.0 | |
| 200 South | GC6255 | 35.6/-45.6 | 86.0 | 89.6 | 3.5 | 13.7 | 0.01 | 4.2 | 1.7 | -1357.5 | |
| 200 South | GC6255 | 35.6/-45.6 | 99.0 | 100.2 | 1.2 | 18.0 | 0.02 | 3.8 | 2.8 | -1366.8 | |
| 200 South | GC6267 | 243.4/-65.8 | 80.2 | 81.4 | 1.1 | 11.7 | 0.01 | 18.1 | 12.4 | -1376.3 | |
| 200 South | GC6293 | 63.4/-38.1 | 85.7 | 88.1 | 2.4 | 10.1 | 0.01 | 3.3 | 2.5 | -1352.0 | |
| 200 South | GC6294 | 63.4/-60.7 | 90.6 | 95.5 | 4.3 | 11.7 | 0.01 | 4.2 | 2.4 | -1382.6 | |
| 200 South | GC6295 | 63.4/-85.3 | 63.0 | 64.9 | 1.7 | 7.4 | 0.01 | 17.3 | 7.4 | -1365.0 | |
| 200 South | GC6297 | 143.2/-80.4 | 626.0 | 644.0 | 9.2 | 19.0 | 0.15 | 7.6 | 4.1 | -1939.0 | |
| 200 South | GC6303 | 147.8/-84.6 | 634.0 | 688.8 | 26.1 | 23.1 | 0.19 | 4.7 | 2.1 | -1944.2 | |
| 200 South | GC6304 | 243.4/-23 | 93.0 | 101.1 | 4.4 | 24.7 | 0.02 | 16.7 | 7.9 | -1317.0 | |
| 200 South | GC6307 | 243.5/-78.4 | 565.7 | 569.5 | 3.6 | 13.7 | 0.05 | 5.7 | 2.7 | -1866.7 | |
| 200 South | GC6310 | 251.7/-14.1 | 127.5 | 192.0 | 18.8 | 23.4 | 0.08 | 5.4 | 2.8 | -1313.0 | |
| 200 South | GC6319 | 225.2/-11.5 | 128.3 | 160.6 | 14.1 | 10.3 | 0.01 | 5.4 | 2.8 | -1307.0 | |
| 200 South | GC6319 | 225.2/-11.5 | 224.2 | 227.1 | 2.6 | 24.4 | 0.09 | 0.6 | 0.3 | -1329.9 | |
| 200 South | GC6319 | 225.2/-11.5 | 276.6 | 279.5 | 2.5 | 30.8 | 0.03 | 0.7 | 0.3 | -1342.0 | |
| 200 South | GC6323 | 225.2/-24.3 | 85.0 | 90.2 | 2.5 | 15.4 | 0.01 | 8.2 | 3.6 | -1319.1 | |
| 200 South | GC6354 | 63/-43 | 128.7 | 141.0 | 12.3 | 6.2 | 0.03 | 7.3 | 4.2 | -1400.0 | |
| 200 South | GC6355 | 63/-10 | 165.5 | 167.6 | 1.8 | 6.0 | 0.06 | 6.0 | 3.9 | -1332.7 | |
| 200 South | GC6359 | 63/-69 | 108.0 | 122.8 | 14.8 | 8.2 | 0.01 | 11.1 | 5.3 | -1424.2 | |
| 200 South | GC6375 | 243/-3 | 185.7 | 194.7 | 6.0 | 8.8 | 0.03 | 6.4 | 3.8 | -1313.8 | |
| 200 South | GC6384 | 63/41 | 94.0 | 102.0 | 3.5 | 9.7 | 0.09 | 3.1 | 2.6 | -1216.2 | |
| 200 South | GC6384 | 63/41 | 106.0 | 110.0 | 1.8 | 8.6 | 0.13 | 1.0 | 0.6 | -1210.9 | |
| 200 South | GC6386 | 63.4/20 | 54.0 | 57.0 | 2.2 | 10.1 | 0.02 | 3.7 | 2.8 | -1266.6 | |
| 200 South | GC6388 | 63/-2 | 29.9 | 32.0 | 1.7 | 15.3 | 0.01 | 7.5 | 3.1 | -1293.0 | |
| 200 South | GC6388 | 63/-2 | 36.2 | 39.7 | 2.9 | 11.1 | 0.01 | 10.2 | 5.3 | -1293.0 | |
| 200 South | GC6390 | 63/-29 | 22.7 | 29.0 | 6.3 | 8.2 | 0.01 | 8.9 | 4.3 | -1309.0 | |
| 200 South | GC6390 | 63/-29 | 48.7 | 61.4 | 12.7 | 9.3 | 0.03 | 7.0 | 3.8 | -1323.0 | |
| 200 South | GC6396 | 243/-56 | 19.0 | 22.2 | 2.4 | 15.7 | 0.02 | 2.3 | 1.2 | -1315.0 | |
| 200 South | GC6396 | 243/-56 | 90.4 | 105.0 | 14.0 | 11.4 | 0.01 | 4.7 | 2.7 | -1374.9 | |
| 200 South | GC6396 | 243/-56 | 117.0 | 148.2 | 26.9 | 15.7 | 0.02 | 2.0 | 1.0 | -1396.6 | |
| 200 South | GC6422 | 243/-30 | 52.7 | 55.1 | 2.4 | 29.0 | 0.05 | 5.2 | 2.4 | -1289.0 | |
| 5250 | GC6344 | 201/70 | 31.0 | 54.0 | 22.7 | 11.1 | 0.01 | 3.4 | 1.9 | -34 | |
| East | GC6263 | 353.7/63.5 | 167.0 | 168.0 | 1.0 | 27.4 | 0.06 | 8.0 | 4.0 | 66.5 | |
| East | GC6263 | 353.7/63.5 | 189.4 | 195.5 | 5.6 | 9.0 | 0.12 | 1.4 | 0.7 | 90.3 | |
| East | GC6271 | 53.4/64.7 | 145.2 | 162.7 | 17.4 | 13.5 | 0.01 | 2.9 | 1.7 | 50.4 | |
| East | GC6272 | 229.3/-11.8 | 174.7 | 176.8 | 1.9 | 7.0 | 0.01 | 15.3 | 6.9 | 209.0 | |
| East | GC6273 | 48/33.7 | 211.5 | 245.2 | 28.4 | 18.4 | 0.21 | 3.8 | 1.8 | 32.3 | |
| East | GC6279 | 246.4/0.4 | 215.9 | 235.9 | 15.8 | 9.5 | 0.10 | 6.2 | 1.9 | 259.0 | |
| East | GC6324 | 55.6/28.1 | 497.0 | 533.0 | 34.4 | 13.5 | 0.05 | 11.7 | 1.9 | -80.7 | |
| NWW | GC6376 | 245/-83 | 6.2 | 18.0 | 11.8 | 16.0 | 0.10 | 14.0 | 3.6 | -309 | |
| NWW | GC6376 | 245/-83 | 48.0 | 77.4 | 28.4 | 5.9 | 0.28 | 10.3 | 1.5 | -364 | |
| NWW | GC6383 | 83/-59 | 37.0 | 100.0 | 44.6 | 4.1 | 0.14 | 10.0 | 0.9 | -333 | |
| NWW | GC6383 | 83/-59 | 47.0 | 52.0 | 4.6 | 6.0 | 0.10 | 10.0 | 2.5 | -330 | |
| NWW | GC6383 | 83/-59 | 85.5 | 100.0 | 13.3 | 3.2 | 0.15 | 14.4 | 0.6 | -376 | |
| NWW | GC6383 | 83/-59 | 274.0 | 282.5 | 8.0 | 12.1 | 0.14 | 4.7 | 1.3 | -409 | |
| NWW | GC6383 | 83/-59 | 276.0 | 282.5 | 6.4 | 13.3 | 0.16 | 4.7 | 1.5 | -535 | |
| NWW | GC6387 | 63/-46 | 60.0 | 75.0 | 12.3 | 2.1 | 0.21 | 10.9 | 0.1 | -349 | |
| NWW | GC6387 | 63/-46 | 90.0 | 100.0 | 8.2 | 8.0 | 0.14 | 9.8 | 0.1 | -359 | |
| NWW | GC6387 | 63/-46 | 125.0 | 130.0 | 4.1 | 18.2 | 0.09 | 1.1 | 0.0 | -379 | |
| NWW | GC6387 | 63/-46 | 288.0 | 292.6 | 4.3 | 28.5 | 0.21 | 7.3 | 2.0 | -509 | |
| NWW | GC6394 | 53/-33 | 33.0 | 38.0 | 3.8 | 8.1 | 0.20 | 8.4 | 2.7 | -316 | |
| NWW | GC6394 | 53/-33 | 58.0 | 61.0 | 2.7 | 3.5 | 0.17 | 14.1 | 1.1 | -331 | |
| NWW | GC6394 | 53/-33 | 129.0 | 134.0 | 5.0 | 2.6 | 0.56 | 1.0 | 0.0 | -366 | |
| NWW | GC6402 | 50/-51 | 39.2 | 42.5 | 3.2 | 26.0 | 0.11 | 4.0 | 0.2 | -334 | |
| NWW | GC6402 | 50/-51 | 251.7 | 271.3 | 19.3 | 32.0 | 0.18 | 14.2 | 5.0 | -484 | |
| NWW | GC6428 | 77/-47 | 6.7 | 10.0 | 3.3 | 4.9 | 0.02 | 18.6 | 8.7 | -239 | |
| NWW | GC6428 | 77/-47 | 420.0 | 422.0 | 2.0 | 13.8 | 0.06 | 1.3 | 0.4 | -539 | |
| NWW | GC6429 | 70/-58 | 5.8 | 14.8 | 9.0 | 7.5 | 0.04 | 18.2 | 7.1 | -239 | |
| NWW | GC6429 | 70/-58 | 438.7 | 441.8 | 3.1 | 11.0 | 0.06 | 3.9 | 1.4 | -619 | |
| NWW | GC6429 | 70/-58 | 475.6 | 476.6 | 1.0 | 4.4 | 0.04 | 23.3 | 4.7 | -649 | |
| NWW | GC6430 | 59/-49 | 0.0 | 12.0 | 12.0 | 10.6 | 0.06 | 12.5 | 4.9 | -249 | |
| NWW | GC6430 | 59/-49 | 450.6 | 461.8 | 11.2 | 4.3 | 0.10 | 24.3 | 4.2 | -584 | |
| NWW | GC6437 | 38/-50 | 0.0 | 9.5 | 9.5 | 7.0 | 0.04 | 15.8 | 6.3 | -239 | |
| NWW | GC6437 | 38/-50 | 428.4 | 443.9 | 15.3 | 5.0 | 0.06 | 22.8 | 5.4 | -574 | |
| Southwest Bench | GC6409 | 243/12 | 197.1 | 199.5 | 0.4 | 16.5 | 0.01 | 5.2 | 2.6 | 31 | |
| Southwest Bench | GC6409 | 243/12 | 315.8 | 326.5 | 10.1 | 16.9 | 0.07 | 13.2 | 7.0 | 51 | |
| Southwest Bench | GC6431 | 30/30 | 196.7 | 201.4 | 4.0 | 15.8 | 0.09 | 1.2 | 0.6 | -581 | |
| Upper Plate | GC6213 | 41.5/78.4 | 181.0 | 183.0 | 1.9 | 10.3 | 0.00 | 4.5 | 2.0 | 262.9 | |
| Upper Plate | GC6213 | 41.5/78.4 | 197.0 | 211.3 | 13.6 | 26.4 | 0.02 | 16.0 | 8.3 | 281.2 | |
| West | GC6235 | 63.4/-50.6 | 54.5 | 67.3 | 12.2 | 33.1 | 0.15 | 17.2 | 7.4 | -268.5 | |
| West | GC6235 | 63.4/-50.6 | 95.9 | 110.4 | 14.5 | 72.7 | 0.23 | 9.6 | 5.2 | -143.0 | |
| West | GC6235 | 63.4/-50.6 | 218.0 | 234.0 | 15.0 | 7.7 | 0.03 | 12.3 | 5.5 | -175.8 | |
| West | GC6278 | 46.1/-7.3 | 127.4 | 141.0 | 5.0 | 7.0 | 0.00 | 8.2 | 4.1 | -114.5 | |
| West | GC6278 | 46.1/-7.3 | 168.4 | 192.6 | 10.2 | 9.8 | 0.00 | 15.0 | 7.8 | -120.5 | |
| West | GC6377 | 31/-5 | 104.1 | 117.5 | 13.2 | 10.8 | 0.13 | 6.8 | 2.4 | -374 | |
| West | GC6377 | 31/-5 | 151.8 | 165.0 | 13.1 | 9.2 | 0.11 | 16.6 | 6.2 | -378 | |
| Gallagher Fault Block Exploration | GC6246 | 63.4/-26.1 | 1163.0 | 1170.8 | 7.8 | 9.5 | 0.08 | 7.5 | 4.2 | -1226.0 | |
| Gallagher Fault Block Exploration | GC6258 | 63.4/-15.8 | 1108.8 | 1111.5 | 2.7 | 8.9 | 0.13 | 5.6 | 2.0 | -1088.0 | |
| Upper Plate Exploration | GC6364 | 243.4/45.1 | 366.2 | 370.0 | 2.7 | 1.2 | 0.01 | 10.6 | 5.9 | 364.0 | |
| Upper Plate Exploration | GC6373 | 255/34 | 529.0 | 532.0 | 1.9 | 7.6 | 0.01 | 10.0 | 9.5 | 411 |
Contacts
Anvita M. Patil
Vice President – Investor Relations and Treasurer
Cheryl Turner
Communications Coordinator
800-HECLA91 (800-432-5291)
Investor Relations
Email: hmc-info@hecla.com
Website: http://www.hecla.com