(All amounts expressed in U.S. dollars unless otherwise noted)
TORONTO, Feb. 13, 2025 /PRNewswire/ – Agnico Eagle Mines Limited (NYSE:AEM) (TSX:AEM) (“Agnico Eagle” or the “Company”) today reported financial and operating results for the fourth quarter and full year 2024, as well as future operating guidance.
“I’m pleased to report another year of record operational and financial performance, achieving our production and cost guidance. We are very proud of our team’s work to control costs, which, coupled with a favourable gold price environment, has resulted in record operating margins. This success, along with capital discipline, has enabled us to reduce net debt by $1.3 billion since the beginning of the year and return close to $1.0 billion dollars to our shareholders,” said Ammar Al-Joundi, Agnico Eagle’s President and Chief Executive Officer. “Looking ahead, we will remain laser focused on cost control and capital discipline. Our updated three-year production guidance forecasts stable production at peer leading costs. Our exploration program continues to yield positive results, replacing mineral reserves and increasing our mineral resource base. Given our solid track record of execution, we believe we are well positioned to continue to generate strong returns while we advance our pipeline projects and build the foundations for profitable future growth,” added Mr. Al-Joundi.
Fourth quarter and full year 2024 highlights:
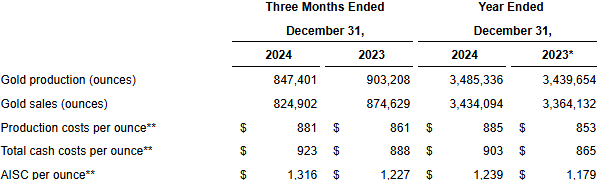
- Solid quarterly gold production and cost performance – Payable gold production1 was 847,401 ounces at production costs per ounce of $881, total cash costs per ounce2 of $923 and all-in sustaining costs (“AISC”) per ounce2 of $1,316
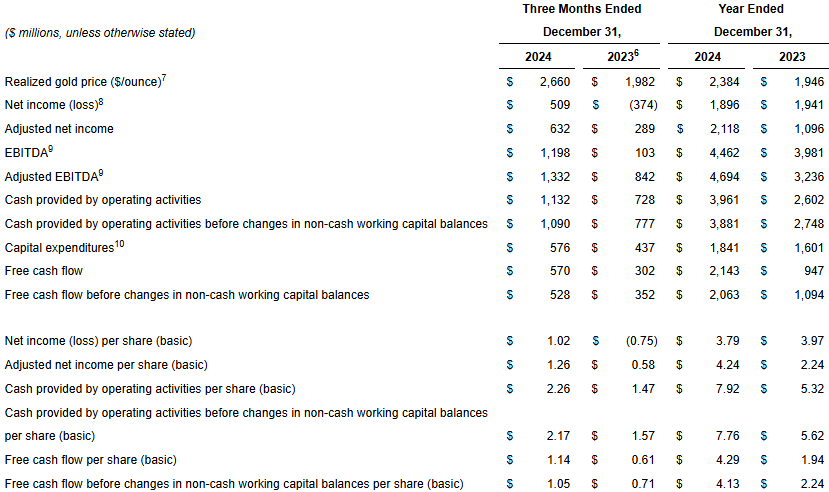
- Record quarterly adjusted net income and strong free cash flow generation – The Company reported quarterly net income of $509 million or $1.02 per share and record adjusted net income3 of $632 million or $1.26 per share. The Company generated record cash provided by operating activities of $1,132 million or $2.26 per share ($1,090 million or $2.17 per share of cash provided by operating activities before changes in non-cash working capital balances4) and free cash flow4 of $570 million or $1.14 per share ($528 million or $1.05 per share of free cash flow before changes in non-cash working capital balances4)
- Record annual gold production and free cash flow driven by solid operational performance – Payable gold production in 2024 was 3,485,336 ounces at production costs per ounce of $885, total cash costs per ounce of $903 and AISC per ounce of $1,239. Production for 2024 was slightly above the midpoint of the Company’s 2024 guidance range of 3.35 million ounces to 3.55 million ounces. Total cash costs per ounce were in-line with the midpoint of the Company’s 2024 guidance and AISC per ounce were within the range of the Company’s 2024 guidance. Cash provided by operating activities for the full year 2024 was $3,961 million and free cash flow was $2,143 million ($2,063 million before changes in non-cash components of working capital). The Company’s continued focus on operational efficiencies resulted in several annual throughput and mining rate records during the year
- Increase in gold mineral reserves and inferred mineral resources – Year-end 2024 gold mineral reserves increased by 0.9% to a record of 54.3 million ounces of gold (1,277 million tonnes grading 1.32 grams per tonne (“g/t”) gold). The year-over-year increase of mineral reserves is in part due to technical evaluations completed for the Upper Beaver project and the declaration of initial mineral reserves at the Wasamac project. At year-end 2024, measured and indicated mineral resources decreased by 2.3% to 43.0 million ounces (1,167 million tonnes grading 1.14 g/t gold) and inferred mineral resources increased by 9.5% to 36.2 million ounces (451 million tonnes grading 2.49 g/t gold). For further details, see the Company’s exploration news release dated February 13, 2025
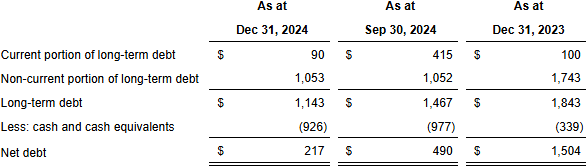
- Strengthened financial position with further debt repayment – The Company continued to reduce debt in the fourth quarter of 2024, repaying the $325 million outstanding balance on the $600 million unsecured term loan facility drawn in 2023 as part of the acquisition of Yamana Gold Inc.’s Canadian assets. Total debt outstanding was $1,143 million as at December 31, 2024. Net debt5 was reduced by $1,287 million in 2024, from $1,504 million at the beginning of the year to $217 million as at December 31, 2024
- Continued focus on shareholder returns – In the fourth quarter of 2024, the Company’s Board of Directors declared a quarterly dividend of $0.40 per share. Additionally, the Company repurchased 248,700 common shares at an average share price of $80.39 for an aggregate of $20 million through its normal course issuer bid (“NCIB”)
- New three-year guidance shows stable production outlook – Payable gold production is forecast to remain stable at approximately 3.3 to 3.5 million ounces annually from 2025 to 2027. While the 2025 and 2026 gold production guidance is slightly lower than the prior three-year guidance issued on February 15, 2024 (“Previous Guidance”) (primarily as a result of the deferral of processing low margin ore), the outlook for 2027 has improved as expected contributions in 2027 from East Gouldie at Canadian Malartic, LaRonde and Macassa are expected to offset lower gold grade sequences at Detour Lake and a decline in production at Meadowbank
- Peer leading total cash costs and AISC reflect stabilized rate of inflation – Total cash costs per ounce and AISC per ounce in 2025 are forecast to be in the range of $915 to $965 and $1,250 to $1,300, respectively. When compared to the full year 2024 total cash costs per ounce of $903 and AISC per ounce of $1,239, the midpoints of these ranges represent an approximate 4% and 3% increase, respectively. The expected cost increases in 2025 are mostly related to lower grade sequence at Fosterville, Canadian Malartic and Meadowbank, along with relatively modest forecast cost increases in labour, spare parts and maintenance
- Increased investment in pipeline projects, with potential to support future production growth – Capital expenditures in 2025 (excluding capitalized exploration) are expected to be between $1.75 billion and $1.95 billion, compared to capital expenditures of $1.66 billion in 2024. Capitalized exploration is forecast to be between $290 million and $310 million, compared to capitalized exploration of $184 million in 2024. The expected increases in 2025 are mostly attributable to additional capital expenditures to advance pipeline projects, including Odyssey, the Detour Lake underground project, the Upper Beaver project and Hope Bay, which the Company believes have the potential to drive profitable growth and generate strong returns in the medium-term
- Enhancing key value drivers and pipeline projects, with a focus on Detour Lake, Canadian Malartic and Hope Bay – Further details on exploration results in 2024 are included in the Company’s exploration news release dated February 13, 2025. The Company expects to provide updates on these initiatives and additional opportunities that are being evaluated throughout 2025
- Detour Lake – In the fourth quarter of 2024, the mill successfully achieved the targeted throughput of 77,000 tonnes per day (“tpd”) (or an equivalent rate of 28 million tonnes per annum (“Mtpa”)), setting a quarterly record for tonnes milled. This success was driven by a stable run-time of 93% and continuous optimization efforts. The Company will continue to advance various optimization initiatives, with a target to increase mill throughput to 79,450 tpd (or an equivalent 29 Mtpa) by 2028. The Company completed site preparation for the excavation of the underground exploration ramp, which is expected to commence in the first half of 2025, following the receipt of the permit to take water. The Company’s exploration program continued to attempt to de-risk the underground project, with conversion drilling resulting in an upgrade of the underground mineral resource at year-end 2024
- Odyssey – In the fourth quarter of 2024, ramp development, shaft sinking activities and surface construction progressed on schedule. At December 31, 2024, the shaft had reached a depth of 1,026 metres at level 102, the top of the mid-shaft loading station. The Company continues to focus on additional upside potential at Odyssey. A successful exploration program in 2024 resulted in the expansion of the East Gouldie mineral resource, which will be used in the continued technical evaluation of a potential second shaft at Odyssey. In the fourth quarter of 2024, the Company also commenced a take-over bid to acquire all of the issued and outstanding common shares (the “O3 Shares”) of O3 Mining Inc. (“O3 Mining”). As at February 3, 2025, the Company had taken up 115,842,990 O3 Shares for aggregate consideration of C$194 million, representing approximately 96.5% of the outstanding O3 Shares on an undiluted basis. The Company expects to complete the acquisition of 100% of the common shares of O3 Mining in the first quarter of 2025, consolidating its land package at Canadian Malartic. O3 Mining owns the Marban deposit, which has the potential to become a satellite open pit to feed the Canadian Malartic mill in the medium-term as part of the Company’s “fill-the-mill” strategy
- Patch 7 at Hope Bay – Exploration drilling in 2024 focused mainly on resource expansion and conversion on the Madrid deposit following the strong drilling intercepts obtained at the Patch 7 zone. An initial indicated mineral resource estimate was declared as at December 31, 2024 for Patch 7 of 0.9 million ounces of gold (4.3 million tonnes grading 6.64 g/t gold). The Company believes these results suggest the potential for a larger production scenario and they are being integrated in the internal technical evaluation of the Hope Bay project, which is expected to be completed in the first half of 2026
- Payable production of a mineral means the quantity of a mineral produced during a period contained in products that have been or will be sold by the Company whether such products are shipped during the period or held as inventory at the end of the period.
- Total cash costs per ounce and all-in sustaining costs per ounce or AISC per ounce are non-GAAP ratios that are not standardized financial measures under IFRS and, in this news release, unless otherwise specified, are reported on (i) a per ounce of gold production basis, and (ii) a by-product basis. For a description of the composition and usefulness of these non-GAAP ratios and reconciliations of total cash costs per ounce and AISC per ounce to production costs on both a by-product and a co-product basis, see “Note Regarding Certain Measures of Performance” below.
- Adjusted net income and adjusted net income per share are non-GAAP measures or ratios that are not standardized financial measures under IFRS. For a description of the composition and usefulness of these non-GAAP measures and a reconciliation to net income see “Note Regarding Certain Measures of Performance” below.
- Cash provided by operating activities before changes in non-cash working capital balances, free cash flow and free cash flow before changes in non-cash working capital balances and their related per share measures are non-GAAP measures or ratios that are not standardized financial measures under IFRS. For a description of the composition and usefulness of these non-GAAP measures and a reconciliation to cash provided by operating activities see “Note Regarding Certain Measures of Performance” below.
- Net debt is a non-GAAP measure that is not a standardized financial measure under IFRS. For a description of the composition and usefulness of this non-GAAP measure and a reconciliation to long-term debt, see “Note Regarding Certain Measures of Performance” below.
Fourth Quarter and Full Year 2024 Results Conference Call and Webcast Tomorrow
Agnico Eagle’s senior management will host a conference call on Friday, February 14, 2025, at 11:00 AM (E.S.T.) to discuss the Company’s financial and operating results.
Via Webcast:
To listen to the live webcast of the conference call, you may register on the Company’s website at www.agnicoeagle.com, or directly via the link here.
Via Phone:
To join the conference call by phone, please dial 416.945.7677 or toll-free 1.888.699.1199 to be entered into the call by an operator. To ensure your participation, please call approximately five minutes prior to the scheduled start of the call.
To join the conference call by phone without operator assistance, you may register your phone number here 30 minutes prior to the scheduled start of the call to receive an instant automated call back.
Replay Archive:
Please dial 289.819.1450 or toll-free 1.888.660.6345, access code 93737#. The conference call replay will expire on March 14, 2025.
The webcast, along with presentation slides, will be archived for 180 days on the Company’s website.
Fourth Quarter and Full Year 2024 Production and Cost Results
Production and Cost Results Summary
* Production and Cost Results Summary reflects Agnico Eagle’s 50% interest in Canadian Malartic up to and including March 30, 2023 and 100% thereafter.
** Production costs per ounce, total cash costs per ounce and AISC per ounce are reported on a per ounce of gold produced basis.
Gold Production
- Fourth Quarter of 2024 – Gold production decreased when compared to the prior-year period primarily due to lower production from Canadian Malartic, La India, Detour Lake and Fosterville, partially offset by higher production at Macassa and Meadowbank
- Full Year 2024 – Gold production increased when compared to the prior year primarily due to higher production from Meadowbank, Canadian Malartic and Macassa, partially offset by lower production at Fosterville and La India
Production Costs per Ounce
- Fourth Quarter of 2024 – Production costs per ounce increased when compared to the prior-year period primarily due to higher royalties arising from higher gold prices and lower production, partially offset by the benefit of the weaker Canadian dollar during the period
- Full Year 2024 – Production costs per ounce increased when compared to the prior year primarily due to higher royalties arising from higher gold prices and higher production costs at Canadian Malartic related to underground mining operations, partially offset by overall higher production and the benefit of the weaker Canadian dollar during the period
Total Cash Costs per Ounce
- Fourth Quarter and Full Year 2024 – Total cash costs per ounce increased when compared to the prior-year periods primarily due to the reasons described above for the increase in production costs per ounce during the respective periods
AISC per Ounce
- Fourth Quarter of 2024 – AISC per ounce increased when compared to the prior-year period due to the factors causing higher total cash costs per ounce during the period as well as higher sustaining capital expenditures, primarily at Canadian Malartic and Detour Lake, partially offset by lower general and administrative expenses during the period
- Full Year 2024 – AISC per ounce increased when compared to the prior year due to the factors causing higher total cash costs per ounce during the year, as well as higher sustaining capital expenditures, primarily at Canadian Malartic, Goldex and Kittila
Fourth Quarter and Full Year 2024 Financial Results
Financial Results Summary
| 6 | Certain previously reported line items have been restated to reflect the final purchase price allocation related to the acquisition of the Canadian assets of Yamana Gold Inc. (the “Yamana Transaction”) including the 50% of Canadian Malartic that the Company did not then own. Reflects Agnico Eagle’s 50% interest in Canadian Malartic up to and including March 30, 2023 and 100% thereafter. |
| 7 | Realized gold price is calculated as gold revenues from mining operations divided by the number of ounces sold. |
| 8 | For the first quarter of 2023, includes a $1.5 billion revaluation gain on the 50% interest the Company owned in Canadian Malartic prior to the Yamana Transaction on March 31, 2023. |
| 9 | “EBITDA” means earnings before interest, taxes, depreciation, and amortization. EBITDA and adjusted EBITDA are non-GAAP measures or ratios that are not standardized financial measures under IFRS. For a description of the composition and usefulness of these non-GAAP measures and a reconciliation to net income see “Note Regarding Certain Measures of Performance” below. |
| 10 | Includes capitalized exploration. Capital expenditures is a non-GAAP measure that is not a standardized financial measure under IFRS. For a discussion of the composition and usefulness of this non-GAAP measure and a reconciliation to additions to property, plant and mine development as set out in the consolidated statements of cash flows, see “Note Regarding Certain Measures of Performance” below. |
Net Income
- Fourth Quarter of 2024
- Net income was $509 million ($1.02 per share). This result includes the following items (net of tax): derivative losses on financial instruments of $76 million ($0.15 per share), non-recurring tax adjustments and foreign currency translation losses on deferred tax liabilities of $21 million ($0.04 per share), net asset disposal losses of $12 million ($0.02 per share), foreign exchange losses of $10 million (0.02 per share) and other adjustments of $4 million (0.01 per share)
- Excluding the above items results in adjusted net income of $632 million or $1.26 per share
- Net income of $509 million in the fourth quarter of 2024 increased compared to net loss of $374 million in the prior-year period primarily due to impairment losses recognized in the prior-year period and stronger mine operating margins resulting from higher realized gold prices in the current period, partially offset by losses on derivative financial instruments and higher income and mining tax expenses in the current period
- Full Year 2024 – Net income of $1,896 million decreased compared to the prior year net income of $1,941 million primarily due to the remeasurement gain at Canadian Malartic in the prior year and higher income and mining tax expenses and losses on derivative financial instruments in the current period, partially offset by higher operating margins from higher realized gold prices and higher sales volumes in the current period. The remeasurement gain in the prior year is from the application of purchase accounting relating to a business combination attained in stages, which required the remeasurement of the Company’s previously held 50% interest in Canadian Malartic to fair value
Adjusted EBITDA
- Fourth Quarter of 2024 – Adjusted EBITDA increased when compared to the prior-year period primarily due to stronger mine operating margins from higher realized gold prices and lower general and administrative expenses
- Full Year 2024 – Adjusted EBITDA increased when compared to the prior year primarily due to stronger mine operating margins from higher realized gold prices and higher gold sales
Cash Provided by Operating Activities
- Fourth Quarter and Full Year 2024 – Cash provided by operating activities and cash provided by operating activities before changes in non-cash working capital balances increased when compared to the prior-year periods primarily due to the reasons described above related to the increases in adjusted EBITDA
Free Cash Flow Before Changes in Non-cash Working Capital Balances
- Fourth Quarter and Full Year 2024 – Free cash flow before changes in non-cash working capital balances increased when compared to the prior-year periods due to the reasons described above related to cash provided by operating activities, partially offset by higher additions to property, plant and mine development
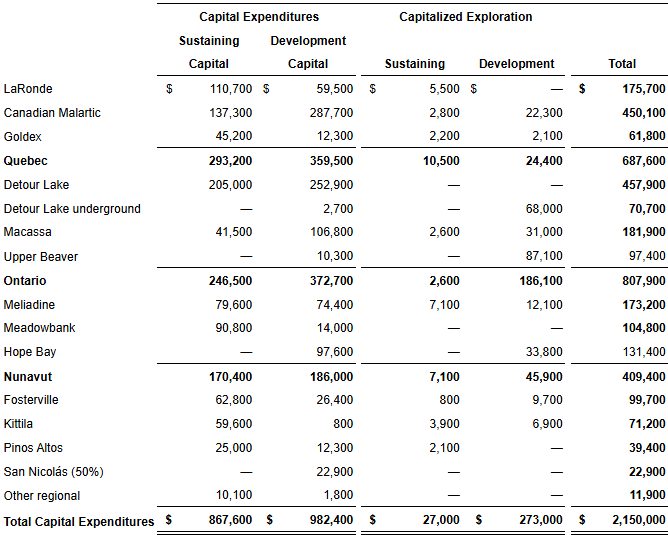
Capital Expenditures
The following table sets out a summary of capital expenditures (including sustaining capital expenditures and development capital expenditures) and capitalized exploration in the fourth quarter and the full year 2024.
Summary of Capital Expenditures*
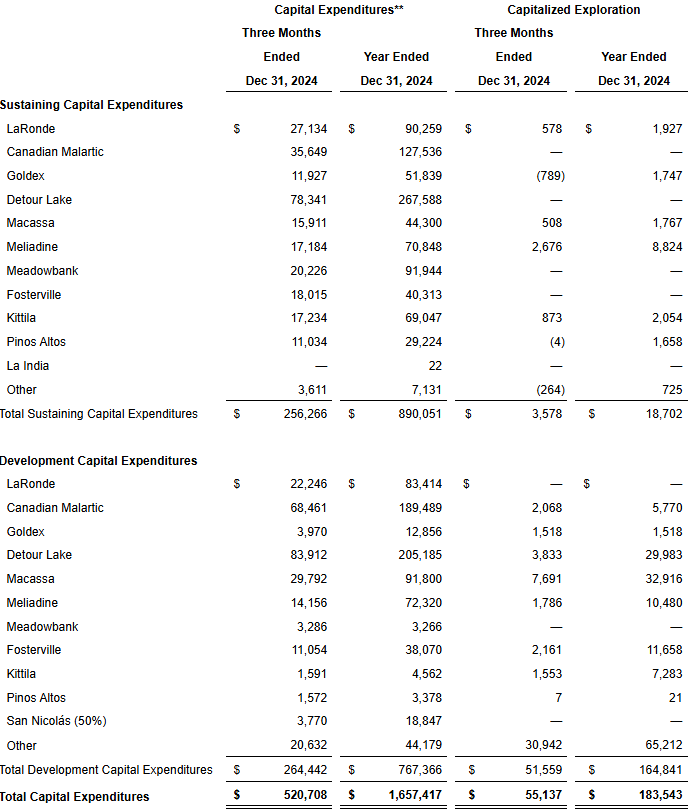
*Capital expenditures is a non-GAAP measure that is not a standardized financial measure under IFRS. For a discussion of the composition and usefulness of this non-GAAP measure and a reconciliation to additions to property, plant and mine development as set out in the consolidated statements of cash flows, see “Note Regarding Certain Measures of Performance” below.
**Excludes capitalized exploration
Strong Free Cash Flow Generation Enabled Debt Repayment Ahead of Maturity to Continue Strengthening the Balance Sheet
Cash and cash equivalents decreased by $51 million when compared to the prior quarter primarily due to $325 million repayment of debt and higher cash used in investing activities resulting from higher capital expenditures, partially offset by higher cash provided by operating activities as a result of higher revenues from higher realized gold prices.
As at December 31, 2024, the Company’s total long-term debt was $1,143 million, a reduction of $324 million from the third quarter of 2024. The outstanding balance of $325 million on the $600 million term loan facility was repaid during the quarter in advance of scheduled maturity in April 2025, further strengthening the Company’s investment grade balance sheet. For the full year 2024, a total of $700 million of debt was repaid. No amounts were outstanding under the Company’s unsecured revolving bank credit facility as at December 31, 2024, and available liquidity under the facility remained at approximately $2 billion, not including the uncommitted $1 billion accordion feature.
The following table sets out the calculation of net debt, which decreased by $273 million when compared to the prior quarter as a result of the early debt repayment, partially offset by a decrease in cash and cash equivalents. For the full year 2024, net debt decreased by $1,287 million, from $1,504 million at the beginning of the year to $217 million as at December 31, 2024.
Net Debt Summary
($ millions)
Hedges
Based on the Company’s currency assumptions used for 2025 cost estimates: approximately 54% of the Company’s total estimated Canadian dollar exposure for 2025 is hedged at an average floor price providing protection in respect of exchange rate movements below 1.37 C$/US$, while allowing for participation in respect of exchange rate movements up to an average of 1.42 C$/US$, approximately 30% of the Company’s total estimated Euro exposure for 2025 is hedged at an average floor price providing protection in respect of exchange rate movements above 1.09 US$/EUR, while allowing for participation in respect of exchange rate movements down to an average of 1.05 US$/EUR, approximately 43% of the Company’s total estimated Australian dollar exposure for 2025 is hedged at an average floor price providing protection in respect of exchange rate movements below 1.49 A$/US$, while allowing for participation in respect of exchange rate movements up to an average of 1.62 A$/US$, and approximately 33% of the Company’s total estimated Mexican peso exposure for 2025 is hedged at an average floor price providing protection in respect of exchange rate movements below 19.50 MXP/US$, while allowing for participation in respect of exchange rate movements up to an average of 23.00 MXP/US$. The Company’s full year 2025 cost guidance is based on assumed exchange rates of 1.38 C$/US$, 1.08 US$/EUR, 1.50 A$/US$ and 20.00 MXP/US$.
Including the diesel purchased for the Company’s Nunavut operations that was delivered as part of the 2024 sealift, approximately 61% of the Company’s estimated diesel exposure for 2025 is hedged at an average benchmark price of $0.73 per litre (excluding transportation and taxes), which is expected to reduce the Company’s exposure to diesel price volatility in 2025. The Company’s full year 2025 cost guidance is based on an assumed diesel benchmark price of $0.78 per litre (excluding transportation and taxes).
Based on these 2025 hedge positions, the Company expects to continue to benefit from the positive foreign exchange impact on all its operating currencies when compared to 2025 cost guidance. The Company will continue to monitor market conditions and anticipates continuing to opportunistically add to its operating currency and diesel hedges to strategically support its key input costs for the balance of 2025. Current hedging positions are not factored into 2025 or future guidance.
Shareholder Returns
Dividend Record and Payment Dates for the First Quarter of 2025
Agnico Eagle’s Board of Directors has declared a quarterly cash dividend of $0.40 per common share, payable on March 14, 2025 to shareholders of record as of February 28, 2025. Agnico Eagle has declared a cash dividend every year since 1983.
Expected Dividend Record and Payment Dates for the 2025 Fiscal Year
| Record Date | Payment Date |
| February 28, 2025* | March 14, 2025* |
| May 30, 2025 | June 16, 2025 |
| September 2, 2025 | September 15, 2025 |
| December 1, 2025 | December 15, 2025 |
*Declared
Dividend Reinvestment Plan
For information on the Company’s dividend reinvestment plan, see: Dividend Reinvestment Plan.
International Dividend Currency Exchange
For information on the Company’s international dividend currency exchange program, please contact Computershare Trust Company of Canada by phone at 1.800.564.6253 or online at www.investorcentre.com or www.computershare.com/investor.
Normal Course Issuer Bid
The Company believes that its NCIB is a flexible and complementary tool that, together with its quarterly dividend, is part of the Company’s overall capital allocation program and generates value for shareholders. The Company can purchase up to $500 million of its common shares under the NCIB, subject to a maximum of 5% of its issued and outstanding common shares. Purchases under the NCIB may continue for up to one year from the commencement day on May 4, 2024. In the fourth quarter of 2024, the Company repurchased 248,700 common shares for an aggregate of $20 million through the NCIB. During the year ended December 31, 2024, the Company repurchased 1,749,086 common shares for an aggregate of $120 million under the NCIB and the Company’s NCIB for the prior period, at an average share price of $68.54.
Fourth Quarter 2024 Sustainability Highlights
- Sean Boyd Inducted into the Canadian Mining Hall of Fame – In January 2025, Sean Boyd, Chair of the Board and retired long-time CEO, was recognized for his role in growing Agnico Eagle from a market capitalization of C$0.4 billion to C$55 billion, and for his notable contributions to the mining sector and communities
- Health and Safety – The Company strives to maintain high health and safety standards. In 2024, multiple sites, and the global exploration team, achieved records for safety performance resulting in a strong global safety performance and an annual Global Combined Injury Frequency Rate of 2.45 (employees and contractors per 1 million hours worked)
- Employee Engagement – The Company continued to see year-over-year increases in employee satisfaction as measured in the Great Place to Work ® survey. The Company believes employee satisfaction and engagement are key drivers of its high employee retention rate across the regions where it operates
- Province of Ontario’s Skills Development Fund – The Company received a C$10 million grant to provide a comprehensive skills development program to support the availability of a qualified workforce in the mining industry. Agnico Eagle will use this funding to continue leading workforce development initiatives in Northern Ontario
- Matachewan First Nation Health Care Centre Grand Opening – The Company was proud to join the Matachewan First Nation as a sponsor as they celebrated the grand opening of their new health care centre Mino-Bimaadiziwin, meaning “a good life”
- Impact Benefit Agreement with Beaverhouse First Nation – The Company signed the Macassa-Amalgamated Kirkland Impact Benefit Agreement with Beaverhouse First Nation, formalizing a sustainable partnership built on collaboration, respect and shared progress. This agreement reflects the Company’s commitment by fostering genuine partnerships that benefit both the community and its operations
- Recognized as a Socially Responsible Company for the 9th consecutive year – The Sonoran Business Foundation honored Agnico Sonora, which operates La India, for achieving the Socially Responsible Company distinction for the ninth consecutive year. The La India mine has been an integral part of the community since 2011
- Forbes’ Canada’s Best Employers – The Company was recognized on the list for the 3rd consecutive year, which is an annual ranking based on employees and other professionals recommending the Company as a desirable employer
Gold Mineral Reserves – Up 1% Year-Over-Year to Record 54.3 Moz at Year-End 2024
At December 31, 2024, the Company’s proven and probable mineral reserve estimate totalled 54.3 million ounces of gold (1,277 million tonnes grading 1.32 g/t gold). This represents a 0.9% (0.47 million ounce) increase in contained ounces of gold compared to the proven and probable mineral reserve estimate of 53.8 million ounces of gold (1,287 million tonnes grading 1.30 g/t gold) at year-end 2023 (see the Company’s news release dated February 15, 2024 for details regarding the Company’s December 31, 2023 proven and probable mineral reserve estimate).
The year-over-year increase in mineral reserves at December 31, 2024 is largely due to a substantial mineral reserve addition at Upper Beaver and Wasamac and an aggregate replacement of approximately 70% of mineral reserves at Fosterville, Macassa, Meliadine, Amaruq and LaRonde.
Mineral reserves were calculated using a gold price of $1,450 per ounce for most operating assets, with exceptions that include: Detour Lake open pit using $1,400 per ounce; Amaruq using $1,650 per ounce; Pinos Altos using $1,800 per ounce; and variable assumptions for some other pipeline projects, including Wasamac using $1,650 per ounce. See “Assumptions used for the December 31, 2024 mineral reserve and mineral resource estimates reported by the Company” below for more details.
Gold Mineral Resources – Increase in Inferred Mineral Resources
At December 31, 2024, the Company’s measured and indicated mineral resource estimate totalled 43.0 million ounces of gold (1,167 million tonnes grading 1.14 g/t gold). This represents a 2.3% (1.0 million ounce) decrease in contained ounces of gold compared to the measured and indicated mineral resource estimate at year-end 2023 (see the Company’s news release dated February 15, 2024 for details regarding the Company’s December 31, 2023 measured and indicated mineral resource estimate).
The year-over-year decrease in measured and indicated mineral resources is primarily due to the upgrade of mineral resources at Upper Beaver and Wasamac to mineral reserves, largely offset by the successful conversion of inferred mineral resources into measured and indicated mineral resources at Detour Lake underground, East Malartic, Upper Beaver, Hope Bay and other sites.
At December 31, 2024, the Company’s inferred mineral resource estimate totalled 36.2 million ounces of gold (451 million tonnes grading 2.49 g/t gold). This represents a 9.5% (3.1 million ounce) increase in contained ounces of gold compared to the inferred mineral resource estimate a year earlier (see the news release dated February 15, 2024 for details regarding the Company’s December 31, 2023 inferred mineral resource estimate).
The year-over-year increase in inferred mineral resources is primarily due to exploration drilling success at Detour Lake underground, East Gouldie, Hope Bay, Meliadine, Fosterville and Macassa.
For detailed mineral reserves and mineral resources data, including the economic parameters used to estimate the mineral reserves and mineral resources, see “Detailed Mineral Reserve and Mineral Resource Data (as at December 31, 2024)” and “Assumptions used for the December 31, 2024 mineral reserve and mineral resource estimates reported by the Company” below, as well as the Company’s exploration news release dated February 13, 2025.
Update on Key Value Drivers and Pipeline Projects
Odyssey
In the fourth quarter of 2024, ramp development continued to progress ahead of schedule, and as at December 31, 2024, the main ramp reached a depth of 912 metres and the ramp towards the mid-shaft loading station reached a depth of 945 metres. Additionally, the Company continued to develop the main ventilation system on Level 54 between Odyssey South and East Gouldie and expects to begin excavating the first air raise for East Gouldie in the second quarter of 2025.
In the fourth quarter of 2024, shaft sinking activities set a record quarterly performance, progressing at a rate of 2.15 metres per day, and, as at December 31, 2024, the shaft reached level 102, the top of the mid-shaft loading station, at a depth of 1,026 metres. The design of the mid-shaft loading station between levels 102 and 114 is in progress. This station will include a crushing and material handling circuit for ore and waste, along with support infrastructure, including a maintenance shop. Excavation of the mid-shaft loading station is expected to begin in the first quarter of 2025 and continue through the remainder of the year.
Construction progressed on schedule and on budget in the fourth quarter of 2024. At the main hoist building, the rope installation for the service hoist was completed in the fourth quarter of 2024. The construction of the temporary loading station on Level 64 progressed according to plan and the service hoist is now expected to be commissioned in the first quarter of 2025, providing a hoisting capacity of 3,500 tpd. In the fourth quarter, the foundations of the main office and service building were completed and the structural steel installation is ongoing. The construction of the main office building is expected to be finished by the first quarter of 2026.
At Odyssey, the pace of construction is expected to increase in 2025, with the focus areas including the expansion of the paste plant to 20,000 tpd, the installation of the mid-shaft material handling infrastructure and the construction of the main underground ventilation system.
Opportunities for growth at Canadian Malartic
Once the Canadian Malartic complex transitions fully to underground, expected in 2029, the mill will have excess capacity of approximately 40,000 tpd. The Company is working on several opportunities to fill the mill, with a vision to potentially reach annual gold production of one million ounces in the 2030s. Some of these opportunities are set out below.
At Odyssey, exploration drilling in 2024 continued to infill the Odyssey North and Odyssey South zones and the adjacent Odyssey internal zones. The East Gouldie deposit continued to grow both westward and eastward, resulting in additional inferred mineral resources. New drill intercepts in the Eclipse Zone established continuity of mineralization and the potential for additional future mineral resource growth in the area located between the East Gouldie and Odyssey deposits. Following these positive exploration results, the Company is evaluating the potential for a second shaft at Odyssey.
In December 2024, the Company commenced a take-over bid to acquire all of the issued and outstanding common shares of O3 Mining, which owns the Marban project adjacent to Canadian Malartic. As at February 3, 2025, the Company had taken up 115,842,990 O3 Shares for aggregate consideration of C$194 million, representing approximately 96.5% of the outstanding O3 Shares on an undiluted basis. The Company expects to complete the acquisition of 100% of the O3 Shares in the first quarter of 2025. The Marban project is an advanced exploration project that could potentially support an open pit mining operation similar to the Company’s Barnat open pit operations at Canadian Malartic. It is expected to contribute approximately 15,000 tpd and an average of approximately 130,000 ounces per year to the Canadian Malartic complex over a span of 9 years, starting as early as 2033. For details on the offer to acquire O3 Mining see the Company’s news release dated December 12, 2024.
At Wasamac, a technical evaluation was completed during the fourth quarter of 2024, based on a 3,000 tpd underground mine with ore transported to the Canadian Malartic mill for processing. The study resulted in the declaration of initial mineral reserves of 1.38 million ounces of gold (14.8 million tonnes grading 2.9 g/t gold). In 2025, the Company will continue to assess various scenarios regarding optimal mining rates and transportation for possible mine construction at the project, while also advancing permitting and community engagement.
Detour Lake
In June 2024, the Company released the results of a technical study reflecting the potential for a concurrent underground operation at Detour Lake that would accelerate access to higher grade ore and increase average annual production to approximately one million ounces over 14 years starting in 2030 (see the Company’s news release dated June 19, 2024). This project is expected to generate strong returns, combined with significant exploration growth upside. On this basis, in June 2024, the Company approved a 2.0 kilometre exploration ramp to a depth of approximately 270 metres, which will provide access for underground conversion and expansion drilling and to collect a bulk sample from the shallow mineralized zone west of the pit.
In the fourth quarter of 2024, the Company completed the site preparation for the excavation of the underground exploration ramp. The permit to take water for this initial phase is now expected to be received in the first half of 2025. Upon receipt of the permit, the Company will commence the excavation of the ramp.
The Company’s continuing exploration program attempts to de-risk the underground project in the western plunge of the main orebody hosting the producing open pits. Conversion drilling continues to confirm the project with underground indicated mineral resources reaching 1.87 million ounces of gold (27.7 million tonnes grading 2.10 g/t gold) at year end. Underground inferred mineral resources continued to grow in 2024 below and to the west of the open pit, and totalled 3.68 million ounces of gold (59.3 million tonnes grading 1.93 g/t gold) at year end. For further details on exploration results at Detour Lake, see the Company’s exploration news release dated February 13, 2025.
Upper Beaver
A positive internal evaluation was completed in June 2024 for a standalone mine and mill scenario at Upper Beaver (see the Company’s news release dated July 31, 2024). This project has the potential to produce an annual average of approximately 210,000 ounces of gold and 3,600 tonnes of copper over a 13-year mine life, with initial production possible as early as 2030. In July 2024, the Company approved a $200.0 million investment over approximately three years to further attempt to de-risk the project. With this investment, the Company intends to develop an exploration ramp and an exploration shaft to depths of 160 metres and 760 metres, respectively, to establish underground drilling platforms and to collect bulk samples from the two most representative geological zones of the Upper Beaver deposit.
In the second half of 2024, project construction progressed on schedule. The road access, main earthworks for the site and the temporary infrastructure, including offices and temporary water treatment plant, were completed. The power line was commissioned and energized in October 2024. The shaft collar was excavated, the Galloway was installed and the foundations for the headframe were completed. Sinking of the exploration shaft is expected to commence in the fourth quarter of 2025. At the exploration ramp, the excavation of the box cut for the portal is ongoing and is expected to be completed in the first quarter of 2025.
The Upper Beaver technical evaluation was completed during the fourth quarter, bringing the mineral reserves at December 31, 2024 to 2.77 million ounces of gold and 54,930 tonnes of copper (23.2 million tonnes grading 3.71 g/t gold and 0.24% copper). The Company is advancing permitting and conducting several studies for the preparation of the impact assessment. The Company expects to submit the impact assessment late in 2025.
Hope Bay – Initial indicated mineral resource declared for Patch 7; advancing the potential for a larger production scenario
Exploration drilling in 2024 totalled more than 119,000 metres, focused mainly on mineral resource expansion and conversion on the Madrid deposit following the strong drilling intercepts obtained at the Patch 7 zone during the fourth quarter of 2023. An initial indicated mineral resource estimate was declared as at December 31, 2024 for Patch 7 of 0.9 million ounces of gold (4.3 million tonnes grading 6.64 g/t gold). These evaluation results are being integrated in an internal evaluation for a potential larger production scenario at Hope Bay, which is expected to be completed in the first half of 2026.
Following these exploration results in 2024, the Company has gained confidence on the potential for a larger production scenario and, having regard to the logistics of operating in Nunavut, is planning to invest approximately $97 million in 2025 to upgrade existing infrastructure and advance site preparedness for a potential redevelopment, including expanding the existing camp, dismantling the existing mill, extending the air strip and completing early earthworks. The Company has also approved a $20 million investment for an exploration ramp at Madrid. The 2.1-km exploration ramp is expected to be developed to a depth of 100 metres to facilitate infill and expansion drilling along the Madrid zones. The exploration ramp is expected to be extended towards Suluk and Patch 7 in 2026 to facilitate infill and expansion drilling along those zones and potentially collect a bulk sample.
For further details on exploration results at Hope Bay, see the Company’s exploration news release dated February 13, 2025.
San Nicolás Copper Project (50/50 joint venture with Teck Resources Limited)
In the fourth quarter of 2024, Minas de San Nicolás continued working on a feasibility study and execution strategy development, with completion expected in the second half of 2025. Project approval is expected to follow, subject to receipt of permits and the results of the feasibility study.
New Three Year Guidance – Stable Gold Production Through 2027; Total Cash Costs and AISC for 2025 Remain Peer Leading; Increased Investment to Build Foundations for Future Growth
Gold production is forecast to remain stable at approximately 3.30 to 3.50 million ounces annually in 2025 to 2027, consistent with gold production in 2024, and approximately 3% lower than Previous Guidance in years 2025 and 2026. The outlook for 2027 has improved as contributions in 2027 from East Gouldie at Canadian Malartic, LaRonde and Macassa are expected to offset lower gold grade sequences at Detour Lake and the decline in production at Meadowbank.
Total cash costs per ounce and AISC per ounce guidance for 2025 increased by approximately 4% and 3%, respectively, compared to the full year 2024 results. The 2025 production and cost guidance summary and a detailed description of the three-year guidance plan is set out below.
On February 1, 2025, an executive order was signed by the President of the United States, which introduced tariffs on imports from countries including Canada. In response, the Canadian government announced retaliatory tariffs on imports from the United States. Subsequently, both countries postponed their previously announced tariffs for 30 days. The Company believes its revenue structure will be largely unaffected by the tariffs as its gold production is mostly refined in Canada, Australia or Europe. The Company is reviewing its exposure to the potential tariffs and alternatives to inputs sourced from suppliers that may be subject to the tariffs, if implemented. However, approximately 60% of the Company’s cost structure relates to labour, contractors, energy and royalties, which are not expected to be directly affected by any of the tariffs. While there is uncertainty as to whether the tariffs or retaliatory tariffs will be implemented, the quantum of such tariffs, the goods on which they may be applied and the ultimate effect on the Company’s supply chains, the Company will continue to monitor developments and may take steps to limit the impact of any tariffs as may be appropriate in the circumstances. The costs guidance set out below does not factor any potential impact from such tariffs.
2025 Guidance Summary
($ millions, unless otherwise stated)
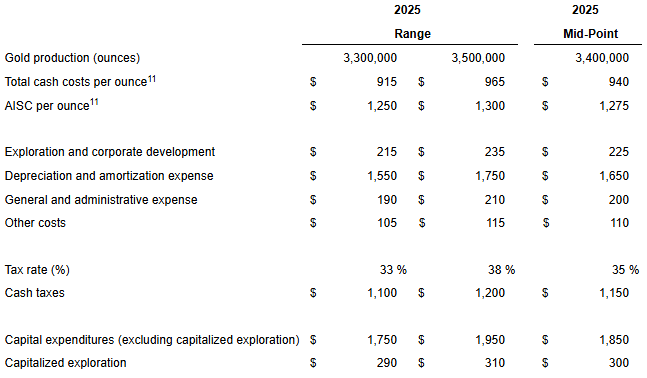
| 11 | The Company’s guidance for total cash costs per ounce and AISC per ounce is forward-looking non-GAAP information. For a description of the composition and usefulness of these non-GAAP measures and ratios, see “Note Regarding Certain Measures of Performance” below. |
Updated Three-Year Guidance Plan
Mine by mine production and cost guidance for 2025 and mine by mine gold production forecasts for 2026 and 2027 are set out in the tables below. The Company continues to evaluate opportunities to further optimize and improve gold production and unit cost forecasts from 2025 through 2027.
Estimated Payable Gold Production (ounces)
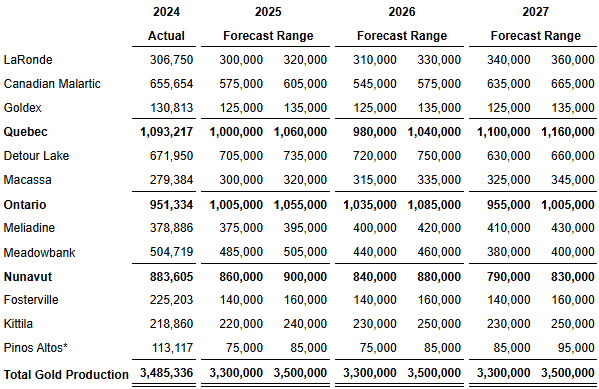
*2024 actual figure includes production from La India and Creston Mascota mines.
Gold production for 2025 and 2026, forecast to be 3.30 to 3.50 million ounces annually, is approximately 3% lower than Previous Guidance, primarily as a result of the deferral of processing low margin ore to later years.
The slight decrease in gold production forecast for 2025 compared to Previous Guidance reflects (i) a reduced mining rate at Pinos Altos to accommodate more challenging ground conditions at Santo Nino and increased ore sourcing from satellite deposits, (ii) a deferral of the restart of pre-crushing lower grade ore at Canadian Malartic allowing for a slower ramp-up of in-pit tailings disposal and (iii) a deferral of the processing of Amalgamated Kirkland (“AK”) ore at the LaRonde mill to the fourth quarter of 2025.
The slight decrease in gold production in 2026 reflects primarily (i) the reduced mining rate at Pinos Altos, (ii) an adjustment to the mining sequence at LaRonde, resulting in increased sourcing from the shallower, lower grade zones combined with a slower mining rate at the deep mine, (iii) an adjustment to the mill ramp-up and mining sequence at Detour Lake, in line with the mining profile update set out in the Company’s news release dated June 19, 2024 and (iv) a slight adjustment to the mining sequence at Macassa.
The gold production outlook for 2027 has improved and is forecast to remain stable at 3.30 to 3.50 million ounces. This improvement is related to additional production from Canadian Malartic (production ramp-up at East Gouldie), from LaRonde (higher gold grade sequence and increased contributions from new zones) and from Macassa and Meliadine (operational improvements). The additional production in 2027 is expected to offset lower production from Detour Lake (lower gold grades in the mining sequence) and from Meadowbank (operation nearing the end of its mine life).
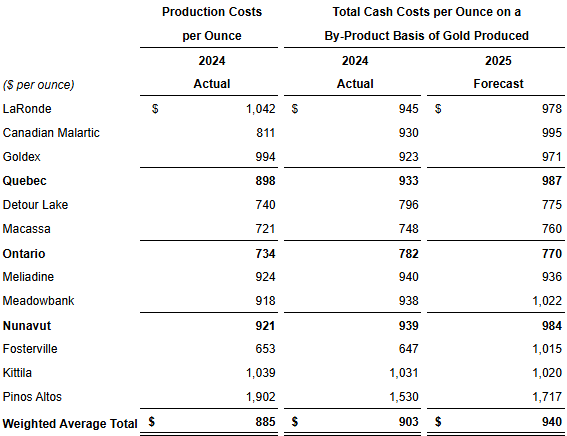
*Forecast total cash costs per ounce are based on the mid-point of 2025 production guidance as set out in the table above.
Total cash costs per ounce in 2025 are expected to increase 4% compared to 2024 and are largely a result of a lower grade sequence at Fosterville, Canadian Malartic and Meadowbank, and modest inflation expected on labour, spare parts and maintenance costs. The increase in costs remains below the rate of inflation for the mining sector. The Company expects stable unit costs through 2026 and 2027, excluding inflation.
AISC per ounce in 2025 are expected to increase 3% compared to 2024 costs and are largely a result of the same reasons for the expected higher total cash costs per ounce. AISC per ounce are expected to remain stable through 2026 and 2027, excluding inflation.
The Company remains focused on attempting to reduce costs through productivity improvements and innovation initiatives at all of its operations and the realization of additional operational synergies is not currently factored into the cost guidance.
Currency and commodity price assumptions used for 2025 cost estimates and sensitivities are set out in the table below.
Currency and commodity price assumptions used for 2025 cost estimates and sensitivities
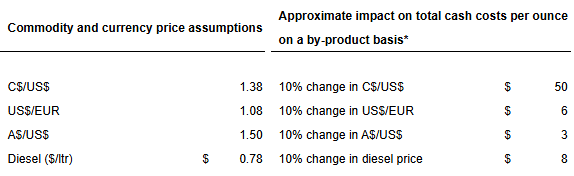
*Excludes the impact of current hedging positions
Exploration and Corporate Development Expense Guidance
Exploration and corporate development expenses in 2025 are expected to be between $215 million and $235 million, based on a mid-point forecast of $153 million for expensed exploration and $72 million in project technical evaluations and other expenses. The guidance for 2025 is consistent with 2024 exploration and corporate development expenses.
Depreciation Expense Guidance
Depreciation and amortization expense in 2025 is expected to be between $1.55 and $1.75 billion.
General and Administrative Expense Guidance
General and administrative expenses in 2025 are expected to be between $190 and $210 million, including share-based compensation, which is expected to be between $55 and $65 million.
Other Expenses Guidance
Additional other expenses in 2025 are expected to be approximately $105 to $115 million. This includes $82 to $85 million related to site maintenance costs primarily at Hope Bay, La India and Northern Territory in Australia and $23 to $30 million related to remediation expenses and other miscellaneous costs.
Tax Guidance
For 2025, the Company expects its effective tax rates to be:
- Canada – 35% to 40%
- Mexico – 35% to 40%
- Australia – 30%
- Finland – 20%
The Company’s overall effective tax rate is expected to be approximately 33% to 38% for the full year 2025.
The Company estimates consolidated cash taxes of approximately $1.1 to $1.2 billion in 2025 at prevailing gold prices, compared to $474 million in 2024. The increase in cash taxes from 2024 reflects both expected higher operating margins and approximately $400 million for the remaining cash tax liability related to the 2024 taxation year, which is to be paid in the first quarter of 2025. The remaining cash taxes in 2025 are expected to be paid equally over the 12 months in the year.
Capital Expenditures Guidance
In 2025, estimated capital expenditures (excluding capitalized exploration) are expected to be between $1.75 billion and $1.95 billion, with a mid-point of $1.85 billion, which includes approximately $868 million of sustaining capital expenditures at the Company’s operating mines and approximately $982 million of development capital expenditures. In 2025, estimated capitalized exploration expenditures are expected to be between $290 million and $310 million.
This compares to the full year 2024 capital expenditures of $1.66 billion (which included $890 million of sustaining capital expenditures and $767 million of growth capital expenditures) and capitalized exploration of $184 million.
Sustaining capital expenditures remain largely in line year-over-year. The overall increase in capital expenditures when compared to 2024 reflects reinvestment in the business to lay the groundwork for future growth through both development capital expenditures and capitalized exploration.
The increase of $215 million in development capital expenditures in 2025 when compared to 2024 is primarily at Canadian Malartic, Hope Bay and Macassa. At Canadian Malartic, 2025 is expected to be the most intensive year for the construction of the Odyssey mine. At Hope Bay, with the exploration results in 2024, the Company has gained confidence in the potential for a larger production scenario and, having regard to the logistics of operating in Nunavut, is planning to upgrade existing infrastructure and advance site preparedness for potential redevelopment. At Macassa, with the operation switching from being mine constrained to mill constrained in 2024, the Company is planning to upgrade the crushing circuit to optimize the mill throughput in coming years.
The increase of $116 million in capitalized exploration in 2025 when compared to 2024 is largely a result of the measured investments for the exploration ramp at the Detour Lake underground project and the exploration ramp and shaft at the Upper Beaver project, as announced in mid-2024. The Company has also approved a $20 million investment for an exploration ramp at Madrid. The 2.1-km exploration ramp is expected to be developed to a depth of 100 metres to facilitate infill and expansion drilling along the Madrid zones. The exploration ramp is expected to be extended towards Suluk and Patch 7 in 2026 to facilitate infill and expansion drilling along those zones and potentially collect a bulk sample.
Estimated 2025 Capital Expenditures
($ thousands)
Updated Three-Year Operational Guidance Plan
Since the Previous Guidance, there have been several operating developments resulting in changes to the updated three-year production profile. Descriptions of these changes as well as initial 2027 guidance are set out below.
ABITIBI REGION, QUEBEC
| LaRonde Forecast | 2024 | 2025 | 2026 | 2027 | |
| Previous Guidance (mid-point) (oz) | 295,000 | 310,000 | 340,000 | n.a. | |
| Current Guidance (mid-point) (oz) | 306,750 (actual) | 310,000 | 320,000 | 350,000 | |
| LaRonde Forecast 2025 | Ore Milled(‘000 tonnes) | Gold (g/t) | Gold MillRecovery (%) | Silver (g/t) | Silver MillRecovery (%) |
| 2,789 | 3.69 | 93.7 % | 8.5 | 72.6 % | |
| Production and Minesite Costs per Tonne12 | Zinc (%) | Zinc MillRecovery (%) | Copper (%) | Copper MillRecovery (%) | |
| C$167 | 0.40 % | 69.1 % | 0.12 % | 81.1 % |
At LaRonde, the production forecast aligns with Previous Guidance in 2025 and is slightly lower in 2026, primarily due to an adjustment to the mining sequence resulting in lower gold grades. The Company has integrated new sources of ore to the LaRonde production profile, including the Fringe, Dumagami and 11-3 zones, and has adjusted the mining rate in the deep mine. These new zones enhance mine production flexibility, which is expected to help manage seismicity at depth.
Gold production is expected to increase to 350,000 ounces of gold in 2027, primarily due to higher gold grades at the LaRonde mine, an increase in the mining rate at the LaRonde Zone 5 (“LZ5”) mine to 3,800 tpd and the addition of the new zones.
LaRonde has planned a shutdown of 10 days in the second quarter of 2025 in order to replace the liners at the SAG mill and overall maintenance of the drystack filtration plant.
| __________ | |
| 12 | Minesite costs per tonne is a non-GAAP measure that is not standardized under IFRS and is reported on a per tonne of ore milled basis. For a description of the composition and usefulness of this non-GAAP measure and a reconciliation to production costs see “Note Regarding Certain Measures of Performance” below. |
| Canadian Malartic Forecast | 2024 | 2025 | 2026 | 2027 |
| Previous Guidance (mid-point) (oz) | 630,000 | 615,000 | 560,000 | n.a. |
| Current Guidance (mid-point) (oz) | 655,654 (actual) | 590,000 | 560,000 | 650,000 |
| Canadian Malartic Forecast 2025 | Ore Milled(‘000 tonnes) | Gold (g/t) | Gold MillRecovery (%) | Production and Minesite Costs per Tonne |
| 21,076 | 0.96 | 90.7 % | C$39 |
At Canadian Malartic, the production forecast is lower in 2025 when compared to Previous Guidance primarily due to the Company’s decision to defer the reintroduction of pre-crushed low-grade ore, to accommodate modifications to the in-pit tailings approach and ramp-up.
Production is forecast to be in line with Previous Guidance in 2026 and increase by approximately 95,000 ounces of gold to 650,000 ounces of gold in 2027, with the contribution from East Gouldie at Odyssey.
From 2025 to 2027, production is expected to be sourced from the Barnat pit and increasingly complemented by ore from Odyssey and low-grade stockpiles. Odyssey is expected to contribute approximately 85,000 ounces of gold in 2025, approximately 120,000 ounces of gold in 2026 and approximately 240,000 ounces of gold in 2027.
In 2025, Canadian Malartic has planned quarterly shutdowns of four to five days for the regular maintenance at the mill.
| Goldex Forecast | 2024 | 2025 | 2026 | 2027 |
| Previous Guidance (mid-point) (oz) | 130,000 | 130,000 | 130,000 | n.a. |
| Current Guidance (mid-point) (oz) | 130,813 (actual) | 130,000 | 130,000 | 130,000 |
| Goldex Forecast 2025 | Ore Milled(‘000 tonnes) | Gold (g/t) | Gold MillRecovery (%) | |
| 3,205 | 1.49 | 84.7 % | ||
| Production and Minesite Costs per Tonne | Copper (%) | Copper Mill Recovery (%) | ||
| C$61 | 0.08 % | 85.4 % |
At Goldex, the production forecast is in line with Previous Guidance, with Akasaba West contributing approximately 12,000 ounces of gold and approximately 2,300 tonnes of copper per year.
ABITIBI REGION, ONTARIO
| Detour Lake Forecast | 2024 | 2025 | 2026 | 2027 |
| Previous Guidance (mid-point) (oz) | 690,000 | 725,000 | 760,000 | n.a. |
| Current Guidance (mid-point) (oz) | 671,949 (actual) | 720,000 | 735,000 | 645,000 |
| Detour Lake Forecast 2025 | Ore Milled(‘000 tonnes) | Gold (g/t) | Gold MillRecovery (%) | Production and Minesite Costs per Tonne |
| 28,000 | 0.88 | 90.9 % | C$28 |
At Detour Lake, the production forecast is lower in 2025 and 2026 when compared to Previous Guidance. The lower production in 2025 and 2026 is primarily due to lower grades from a slight adjustment to the mining sequence and an adjusted mill ramp-up to 29 Mtpa, as described in the June 2024 Detour Lake update (see the Company’s news release dated June 19, 2024). In 2027, the production forecast is lower when compared to 2026 as the mine enters into a lower grade phase.
From 2025 to 2027, the Detour Lake open pit will enter into a higher strip ratio phase, ranging from 3.0 to 4.0, compared to a strip ratio of 1.3 in 2024.
Detour Lake has scheduled three major shutdowns, each lasting seven days, for regular mill maintenance in the first, second and fourth quarters of 2025.
| Macassa Forecast | 2024 | 2025 | 2026 | 2027 |
| Previous Guidance (mid-point) (oz) | 275,000 | 330,000 | 340,000 | n.a. |
| Current Guidance (mid-point) (oz) | 279,385 (actual) | 310,000 | 325,000 | 335,000 |
| Macassa Forecast 2025 | Ore Milled(‘000 tonnes) | Gold (g/t) | Gold MillRecovery (%) | Production and Minesite Costs per Tonne |
| 700 | 14.15 | 97.3 % | C$464 |
At Macassa, the production forecast in 2025 and 2026 is lower when compared to Previous Guidance, primarily due to the deferral of production from the AK deposit. The Company initially planned to start trucking and processing ore from AK at the LZ5 processing facility at LaRonde in the fourth quarter of 2024. Due to delays in the modifications at the LZ5 processing facility to accommodate the AK ore, the Company now expects to begin processing the AK ore at the LZ5 mill in the fourth quarter of 2025. Production from the AK deposit is forecast to be approximately 10,000 ounces of gold in 2025, and approximately 50,000 to 60,000 ounces of gold in 2026 and in 2027.
The higher production in 2027 when compared to 2026 reflects the optimization of the Macassa mill.
The Company continues to see geological potential at Macassa along strike and at depth of the South Mine Complex and Main Break. These geological structures are prospective for ongoing expansion of the mineral resource base at the site. Overall, the Company believes that Macassa has the potential to maintain production in excess of 300,000 ounces of gold per year based on expected exploration results.
Macassa has scheduled a major shutdown of five days in the fourth quarter of 2025, for the primary grinding mill liner replacement, the annual overhaul of the crusher and other regular mill maintenance.
NUNAVUT
| Meliadine Forecast | 2024 | 2025 | 2026 | 2027 |
| Previous Guidance (mid-point) (oz) | 370,000 | 385,000 | 410,000 | n.a. |
| Current Guidance (mid-point) (oz) | 378,886 (actual) | 385,000 | 410,000 | 420,000 |
| Meliadine Forecast 2025 | Ore Milled(‘000 tonnes) | Gold (g/t) | Gold MillRecovery (%) | Production and Minesite Costs per Tonne |
| 2,280 | 5.46 | 96.2 % | C$218 |
At Meliadine, the production forecast for 2025 and 2026 aligns with Previous Guidance. The Processing Plant expansion was completed and commissioned in the second half of 2024. Mill throughput is expected to increase to approximately 6,250 tpd in 2025, then to approximately 6,500 tpd in subsequent years, driving the higher gold production forecast in 2025, 2026 and 2027.
Meliadine has scheduled quarterly shutdowns lasting three to six days for regular mill maintenance.
| Meadowbank Forecast | 2024 | 2025 | 2026 | 2027 |
| Previous Guidance (mid-point) (oz) | 490,000 | 495,000 | 450,000 | n.a. |
| Current Guidance (mid-point) (oz) | 504,719 (actual) | 495,000 | 450,000 | 390,000 |
| Meadowbank Forecast 2025 | Ore Milled(‘000 tonnes) | Gold (g/t) | Gold MillRecovery (%) | Production and Minesite Costs per Tonne |
| 4,174 | 4.05 | 91.1 % | C$167 |
At Meadowbank, the production forecast in 2025 and 2026 aligns with Previous Guidance. Production in 2027 is expected to decline as the open pit depletes, with Amaruq’s end of mine life currently expected to be in 2028. With the operational improvements realized over the last two years, the contribution from Amaruq underground has increased and is now forecast to be approximately 160,000 ounces of gold in 2025, and approximately 130,000 ounces of gold in 2026 and 2027. The Company is exploring the possibility of extending the mine’s operational life beyond 2028, focusing solely on underground production. Preliminary findings from this evaluation are expected in the first half of 2026.
The Company continues to account for the caribou migration in its production plan as this migration can affect the ability to move materials on the road between Amaruq and the Meadowbank processing facility and between the Meadowbank processing facility and Baker Lake. Wildlife management is an important priority and the Company is working with Nunavut stakeholders to optimize solutions to safeguard wildlife and reduce production disruptions.
Meadowbank has scheduled two major shutdowns, each lasting five days, to replace the SAG and ball mill liners and complete other regular mill maintenance in the second and fourth quarters of 2025.
AUSTRALIA
| Fosterville Forecast | 2024 | 2025 | 2026 | 2027 |
| Previous Guidance (mid-point) (oz) | 210,000 | 150,000 | 150,000 | n.a. |
| Current Guidance (mid-point) (oz) | 225,203 (actual) | 150,000 | 150,000 | 150,000 |
| Fosterville Forecast 2025 | Ore Milled(‘000 tonnes) | Gold (g/t) | Gold MillRecovery (%) | Production and Minesite Costs per Tonne |
| 850 | 5.83 | 94.1 % | A$268 |
At Fosterville, the production forecast in 2025 and 2026 is in line with Previous Guidance and is expected to remain stable in 2027. The declining production in 2025 when compared to 2024 reflects the depletion of the high-grade Swan zone in 2024. With the commencement of operations in Robbins Hill and site operational improvements, the mining and milling rate is forecast to increase by approximately 5% in 2025, partially offsetting the lower average gold grade of approximately 5.83 g/t.
An initial assessment shows the potential to increase production to an average of approximately 175,000 ounces of gold per year, with a gradual increase in production starting as early as 2027. The Company is conducting further technical evaluations and drilling to confirm the feasibility of this scenario, with a target to incorporate the results as part of its 2025 life of mine update.
Fosterville has scheduled quarterly shutdowns of five days for regular mill maintenance in 2025.
FINLAND
| Kittila Forecast | 2024 | 2025 | 2026 | 2027 |
| Previous Guidance (mid-point) (oz) | 230,000 | 230,000 | 240,000 | n.a. |
| Current Guidance (mid-point) (oz) | 218,860 (actual) | 230,000 | 240,000 | 240,000 |
| Kittila Forecast 2025 | Ore Milled(‘000 tonnes) | Gold (g/t) | Gold MillRecovery (%) | Production and Minesite Costs per Tonne |
| 2,050 | 4.15 | 84.1 % | € 106 |
At Kittila, the production forecast in 2025 and 2026 is in line with Previous Guidance and is expected to remain stable in 2027.
Kittila has planned a major shutdown in the second quarter of 2025 lasting 12 days for regular maintenance on the autoclave.
MEXICO
| Pinos Altos Forecast | 2024 | 2025 | 2026 | 2027 |
| Previous Guidance (mid-point) (oz) | 102,500 | 130,000 | 120,000 | n.a. |
| Current Guidance (mid-point) (oz) | 88,433 (actual) | 80,000 | 80,000 | 90,000 |
| Pinos Altos Forecast 2025 | Total Ore(‘000 tonnes) | Gold (g/t) | GoldRecovery (%) | |
| 1,350 | 1.96 | 94.0 % | ||
| Production and Minesite Costs per Tonne | Silver (g/t) | Silver MillRecovery (%) | ||
| $118 | 44.53 | 44.8 % |
At Pinos Altos, the production forecast is lower than the Previous Guidance by 50,000 ounces and 40,000 ounces in 2025 and 2026, respectively. The lower production reflects an adjustment to the mining rate at the Santo Nino deposit to accommodate for more challenging ground conditions, the deferral of the Reyna de Plata East open pit and increased ore sourcing from satellite deposits as the mine nears its end of mine life. Production in 2027 is expected to increase when compared to 2026, driven by the expected start of the Reyna de Plata East open pit in late 2026.
2025 Exploration Program and Budget – Continued Focus on Exploration Programs to Advance Pipeline Projects which are Expected to be Significant Future Contributors to Mineral Reserve Growth
In 2025, the Company’s total exploration expenditures and project expenses are expected to be between $505 million and $545 million, with a mid-point of $525 million. The total exploration expenditures include estimated capitalized exploration of $300 million and estimated exploration and corporate development expenses of $225 million, which are comprised of $153 million for expensed exploration and $72 million for project technical evaluations, technical services and other corporate expenses.
The Company’s exploration focus remains on extending mine life at existing operations, testing near-mine opportunities and advancing key value driver projects. Exploration priorities for 2025 include mineral resource conversion and expansion at the Detour Lake underground project and East Gouldie at Canadian Malartic, and advancing Hope Bay.
The Company’s exploration and corporate development guidance and plans for individual mines and projects for 2025 are presented in the Company’s exploration news release dated February 13, 2025.
ABITIBI REGION, QUEBEC
LaRonde – Eight Million Ounce Milestone Achieved; Record Gold Production at LZ5
| LaRonde – Operating Statistics | Three Months Ended December 31, | Year Ended December 31, | ||||||
| 2024 | 2023 | 2024 | 2023 | |||||
| Tonnes of ore milled (thousands of tonnes) | 802 | 663 | 2,849 | 2,658 | ||||
| Tonnes of ore milled per day | 8,717 | 7,207 | 7,784 | 7,282 | ||||
| Gold grade (g/t) | 3.78 | 4.33 | 3.62 | 3.83 | ||||
| Gold production (ounces) | 90,447 | 85,765 | 306,750 | 306,648 | ||||
| Production costs per tonne (C$) | C$ 118 | C$ 137 | C$ 153 | C$ 152 | ||||
| Minesite costs per tonne (C$) | C$ 146 | C$ 157 | C$ 154 | C$ 153 | ||||
| Production costs per ounce | $ 751 | $ 779 | $ 1,042 | $ 977 | ||||
| Total cash costs per ounce | $ 834 | $ 845 | $ 945 | $ 911 |
Gold Production
- Fourth Quarter of 2024 – Gold production increased when compared to the prior-year period primarily due to higher volumes of ore mined and milled at LZ5, partially offset by lower gold grades as expected under the planned mining sequence
- Full Year 2024 – Gold production increased slightly when compared to the prior year due to higher volumes of ore mined and milled at LZ5 as part of the mining plan, offset by lower gold grades as expected from the mining sequence and lower recovery
Production Costs
- Fourth Quarter of 2024 – Production costs per tonne decreased when compared to the prior-year period due to the higher volume of ore milled in the current period, partially offset by increased production costs from the consumption of stockpiles, which results in the incurrence of re-handling costs, and higher underground maintenance and service costs. Production costs per ounce decreased when compared to the prior-year period due to more ounces of gold being produced in the period, partially offset by higher production costs as explained in the costs per tonne analysis
- Full Year 2024 – Production costs per tonne increased when compared to the prior year primarily due to the consumption of stockpiles, which results in the incurrence of re-handling costs, and higher underground maintenance and service costs, partially offset by the higher volume of ore milled in the current period. Production costs per ounce increased when compared to the prior year primarily due to the higher production costs per tonne
Minesite and Total Cash Costs
- Fourth Quarter of 2024 – Minesite costs per tonne decreased when compared to the prior-year period due to the same reasons outlined above regarding the decrease in production costs per tonne. Total cash costs per ounce decreased when compared to the prior-year period for the same reasons outlined above for the decrease in production costs per ounce.
- Full Year 2024 – Minesite costs per tonne increased when compared to the prior year primarily due to the reasons outlined above regarding the increase in production costs per tonne. Total cash costs per ounce increased when compared to the prior year primarily for the same reasons as the increase in production costs per ounce.
Highlights
- In November 2024, LaRonde achieved the significant milestone of eight million ounces of gold poured since the mine began production in 1988
- Gold production in the fourth quarter of 2024 was positively affected by higher grades from increased production from the deep mine area compared to the prior quarter. Production from the higher-grade West mine area stabilized following the completion of rehabilitation work in the third quarter of 2024
- LZ5 achieved record throughput and gold production of approximately 24,300 ounces during the fourth quarter of 2024. The higher throughput was driven by the processing of stockpiles accumulated prior to the restart of the LZ5 mill in August 2024, as well as the Company’s continued automation initiatives at the LZ5 mine. Approximately 1,725 tpd were moved in full year 2024 through automated scoops and trucks, which contributed to the strong overall site throughput performance of an average 3,425 tpd
- At the LaRonde mill, the focus remained on improving mill recoveries by optimizing the blending of ore from the LaRonde mine, 11-3 Zone, LZ5, Goldex and Akasaba West
Canadian Malartic – Development of Odyssey Continues to Advance on Schedule; Shaft Sinking Reached the Mid-Shaft Loading Station Level
| Canadian Malartic – Operating Statistics | Three Months Ended December 31, | Year Ended December 31, | ||||||
| 2024 | 2023 | 2024 | 2023* | |||||
| Tonnes of ore milled (thousands of tonnes) | 5,100 | 5,278 | 20,317 | 19,595 | ||||
| Tonnes of ore milled per day | 55,435 | 57,370 | 55,511 | 53,685 | ||||
| Gold grade (g/t) | 0.97 | 1.08 | 1.09 | 1.17 | ||||
| Gold production (ounces) | 146,485 | 168,272 | 655,654 | 603,955 | ||||
| Production costs per tonne (C$) | C$ 36 | C$ 36 | C$ 36 | C$ 36 | ||||
| Minesite costs per tonne (C$) | C$ 41 | C$ 40 | C$ 41 | C$ 39 | ||||
| Production costs per ounce | $ 902 | $ 825 | $ 811 | $ 771 | ||||
| Total cash costs per ounce | $ 1,014 | $ 913 | $ 930 | $ 824 |
| *Gold production reflects Agnico Eagle’s 50% interest in Canadian Malartic up to and including March 30, 2023 and 100% interest thereafter. Tonnage of ore milled is reported on a 100% basis for both periods. |
Gold Production
- Fourth Quarter of 2024 – Gold production decreased when compared to the prior-year period due to lower grades resulting from a higher portion of ore processed being sourced from the low-grade stockpiles than planned, combined with lower throughput to accommodate adjustments to the in-pit tailings disposal approach
- Full Year 2024 – Gold production increased when compared to the prior year due to the increase in the Company’s ownership of Canadian Malartic between periods from 50% to 100% as a result of the closing of the Yamana Transaction on March 31, 2023 and higher throughput, partially offset by lower gold grades resulting from increased ore sourced from the low-grade stockpile
Production Costs
- Fourth Quarter of 2024 – Production costs per tonne remained the same when compared to the prior-year period primarily due to the decrease in open pit mining costs combined with a higher deferred stripping ratio being offset by the decrease in the volume of ore milled in the period and higher royalty costs. Production costs per ounce increased when compared to the prior-year period due to fewer ounces of gold produced in the current period and higher royalty costs, partially offset by lower open pit mining costs
- Full Year 2024 – Production costs per tonne remained the same when compared to the prior year as the higher royalty costs and higher underground production costs associated with the ramp-up of operations at the Odyssey mine were offset by a higher volume of ore milled. Production costs per ounce increased when compared to the prior year primarily due to higher royalty costs and higher underground production costs associated with the ramp-up of operations at Odyssey, partially offset by more ounces of gold produced in the current period
Minesite and Total Cash Costs
- Fourth Quarter of 2024 – Minesite costs per tonne increased when compared to the prior-year period due to higher royalty costs during the quarter and a lower volume of ore milled. Total cash costs per ounce increased when compared to the prior-year period primarily due to fewer ounces of gold produced in the current period
- Full Year 2024 – Minesite costs per tonne increased when compared to the prior year due to higher royalty costs in the current period partially offset by a higher volume of ore milled. Total cash costs per ounce increased when compared to the prior year for the same reasons outlined above for the increased production costs per ounce
Highlights
- At Odyssey South, total development during the quarter was ahead of plan at approximately 3,630 metres. Gold production was in line with target at approximately 21,500 ounces of gold supported by record performance in December at approximately 3,838 tpd. The increased use of tele-operated and automated equipment, including scoops, trucks, jumbos and cable bolters, were the main drivers for exceeding the development and production targets in the fourth quarter of 2024
- The Company began in-pit tailings disposal in July 2024. During the ramp-up in the fourth quarter of 2024, the Company made adjustments to the process to address the migration of fine materials through the central berm. The adjustments include installing a filtering layer on the central berm. It is expected that in-pit tailings deposition will resume in the first quarter of 2025 and ramp-up to design capacity in the second quarter of 2025
- An update on the Odyssey development and construction highlights is set out in the Update on Key Value Drivers and Pipeline Projects section above. An update on the exploration results is set out in the Company’s exploration news release dated February 13, 2025
Goldex – Record Quarterly Tonnes Milled; Exceeded Target Milling Rate from Akasaba West
| Goldex – Operating Statistics | Three Months Ended December 31, | Year Ended December 31, | ||||||
| 2024 | 2023 | 2024 | 2023 | |||||
| Tonnes of ore milled (thousands of tonnes) | 812 | 672 | 3,076 | 2,887 | ||||
| Tonnes of ore milled per day | 8,826 | 7,304 | 8,404 | 7,910 | ||||
| Gold grade (g/t) | 1.45 | 1.79 | 1.55 | 1.74 | ||||
| Gold production (ounces) | 32,341 | 33,364 | 130,813 | 140,983 | ||||
| Production costs per tonne (C$) | C$ 51 | C$ 55 | C$ 58 | C$ 52 | ||||
| Minesite costs per tonne (C$) | C$ 56 | C$ 58 | C$ 59 | C$ 53 | ||||
| Production costs per ounce | $ 910 | $ 816 | $ 994 | $ 795 | ||||
| Total cash costs per ounce | $ 859 | $ 877 | $ 923 | $ 820 |
Gold Production
- Fourth Quarter of 2024 – Gold production decreased when compared to the prior-year period primarily due to lower gold grades resulting from increased ore sourced from Akasaba West, partially offset by a higher volume of ore processed
- Full Year 2024 – Gold production decreased when compared to the prior year primarily due to lower gold grades resulting from increased ore sourced from Akasaba West and lower recovery, partially offset by a higher volume of ore processed
Production Costs
- Fourth Quarter of 2024 – Production costs per tonne decreased when compared to the prior-year period primarily due a higher volume of ore milled in the current period and a build-up in stockpiles, partially offset by a lower stripping ratio associated with Akasaba West. Production costs per ounce increased when compared to the prior-year period due to the same factors that resulted in higher production costs per tonne and lower gold grades
- Full Year 2024 – Production costs per tonne increased when compared to the prior year primarily due to a lower deferred stripping ratio associated with Akasaba West, partially offset by a higher volume of ore milled in the current period and a build-up in stockpiles. Production costs per ounce increased when compared to the prior year due to the same factors that resulted in higher production costs per tonne and lower gold grades
Minesite and Total Cash Costs
- Fourth Quarter of 2024 – Minesite costs per tonne decreased when compared to the prior-year period mainly due to the higher volume of ore milled. Total cash costs per ounce decreased when compared to the prior-year period mainly due to a build-up in stockpiles
- Full Year 2024 – Minesite costs per tonne increased when compared to the prior year primarily due to the same reasons outlined above for the higher production costs per tonne. Total cash costs per ounce increased when compared to the prior year due to the same reasons outlined above for the higher production costs per ounce
Highlights
- Quarterly record mill throughput of approximately 8,820 tpd was achieved in the fourth quarter
- At Akasaba West, through the ramp-up process, the target milling rate of 1,750 tpd was exceeded in the fourth quarter and, beginning in October 2024, the site began hauling ore to Goldex 24 hours per day. Akasaba West is expected to provide increased production flexibility to Goldex going forward
ABITIBI REGION, ONTARIO
Detour Lake – Record Quarterly Tonnage Milled; Achieved Targeted Milling Rate of 77,000 tpd
| Detour Lake – Operating Statistics | Three Months Ended December 31, | Year Ended December 31, | ||||||
| 2024 | 2023 | 2024 | 2023 | |||||
| Tonnes of ore milled (thousands of tonnes) | 7,086 | 6,608 | 27,462 | 25,435 | ||||
| Tonnes of ore milled per day | 77,022 | 71,826 | 75,033 | 69,685 | ||||
| Gold grade (g/t) | 0.87 | 1.02 | 0.85 | 0.91 | ||||
| Gold production (ounces) | 179,061 | 193,475 | 671,950 | 677,446 | ||||
| Production costs per tonne (C$) | C$ 23 | C$ 25 | C$ 25 | C$ 24 | ||||
| Minesite costs per tonne (C$) | C$ 26 | C$ 27 | C$ 26 | C$ 26 | ||||
| Production costs per ounce | $ 657 | $ 622 | $ 740 | $ 669 | ||||
| Total cash costs per ounce | $ 755 | $ 691 | $ 796 | $ 735 |
Gold Production
- Fourth Quarter of 2024 – Gold production decreased when compared to the prior-year period primarily due to lower gold grades, as expected from the mining sequence, and lower recovery and higher solution losses, partially offset by higher throughput from a higher mill run-time and optimized mill equipment
- Full Year 2024 – Gold production decreased when compared to the prior year primarily due to lower recovery and gold grades, mainly due to abnormal chipping of grinding media affecting grinding efficiency, partially offset by higher throughput from a higher mill run-time and optimized mill performance
Production Costs
- Fourth Quarter of 2024 – Production costs per tonne decreased when compared to the prior-year period mainly due to lower mining and milling costs, partially offset by higher royalty costs and higher open pit maintenance costs and higher volume of ore milled in the current period. Production costs per ounce increased when compared to the prior-year period due to the higher royalty and open pit maintenance costs and lower gold grades
- Full Year 2024 – Production costs per tonne increased when compared to the prior year primarily due to higher open pit maintenance costs, higher milling costs as a result of lower grinding media efficiency in the SAG mill and higher royalty costs, partially offset by a higher stripping ratio and a higher volume of ore milled in the current period. Production costs per ounce increased when compared to the prior year due to the same factors resulting in higher production costs per tonne and lower gold grades
Minesite and Total Cash Costs
- Fourth Quarter of 2024 – Minesite costs per tonne decreased when compared to the prior-year period due to the higher volume of ore milled in the current period. Total cash costs per ounce increased when compared to the prior-year period due to lower grades as expected from the mining sequence
- Full Year 2024 – Minesite costs per tonne remained the same compared to the prior year with the increased production costs being offset by an increase in volume of ore milled in the current period. Total cash costs per ounce increased when compared to the prior year due to the same reasons outlined above for the higher production costs per ounce
Highlights
- Gold production in the fourth quarter of 2024 was slightly above plan driven by record mill throughput but partially offset by slightly lower recoveries
- In the fourth quarter of 2024, the mill achieved throughput of 77,000 tpd (equivalent to 28 Mtpa), setting a quarterly record. This success was driven by a stable run-time of 93% and continuous optimization efforts at the plant. The Company will continue to advance various optimization initiatives, with a target to increase mill throughput to 79,450 tpd (equivalent to 29 Mtpa) by 2028
- Metallurgical recovery remained stable in the fourth quarter of 2024 when compared to the third quarter of 2024 but was slightly lower than expected in the quarter. Recovery was trending upwards towards the end of 2024 and the Company continues to work on recovery improvement initiatives, including potential changes to grind efficiency, gravity optimization and active carbon management
- The expansion of the mine maintenance shop to support increased mining rates and a larger production fleet is ongoing. The new mining service facility is expected to be completed in 2025
- An update on the underground project is set out in the Update on Key Value Drivers and Pipeline Projects section above. An update on the exploration results is set out in the Company’s exploration news release dated February 13, 2025
Macassa – Record Annual and Quarterly Gold Production and Mill Throughput
| Macassa – Operating Statistics | Three Months Ended December 31, | Year Ended December 31, | ||||||
| 2024 | 2023 | 2024 | 2023 | |||||
| Tonnes of ore milled (thousands of tonnes) | 154 | 131 | 574 | 442 | ||||
| Tonnes of ore milled per day | 1,674 | 1,424 | 1,568 | 1,211 | ||||
| Gold grade (g/t) | 15.87 | 14.82 | 15.55 | 16.47 | ||||
| Gold production (ounces) | 76,336 | 60,584 | 279,384 | 228,535 | ||||
| Production costs per tonne (C$) | C$ 498 | C$ 445 | C$ 482 | C$ 475 | ||||
| Minesite costs per tonne (C$) | C$ 489 | C$ 473 | C$ 498 | C$ 503 | ||||
| Production costs per ounce | $ 715 | $ 704 | $ 721 | $ 678 | ||||
| Total cash costs per ounce | $ 708 | $ 763 | $ 748 | $ 731 |
Gold Production
- Fourth Quarter of 2024 – Gold production increased when compared to the prior-year period primarily due to higher throughput from increased productivity from a larger workforce, new ventilation infrastructure, improved equipment availability and the addition of ore sourced from the Near Surface deposit and higher gold grades from the mine sequence
- Full Year 2024 – Gold production increased when compared to the prior year primarily due to higher throughput resulting from increased productivity from a larger workforce, new ventilation infrastructure, improved equipment availability and the addition of ore sourced from the Near Surface deposit, partially offset by lower gold grades
Production Costs
- Fourth Quarter of 2024 – Production costs per tonne increased when compared to the prior-year period due to higher royalty costs and higher site administration costs, partially offset by the higher volume of ore milled in the current period. Production costs per ounce increased when compared to the prior-year period due to increased cost per tonne and the timing of inventory sales, partially offset by the increased gold production in the current period
- Full Year 2024 – Production costs per tonne increased when compared to the prior year due to higher mining costs resulting from an increased mining rate in the period when compared to the prior period and higher royalty costs, partially offset by the higher volume of ore milled in the current period. Production costs per ounce increased when compared to the prior year due to increased cost per tonne, partially offset by the increased gold production in the current period
Minesite and Total Cash Costs
- Fourth Quarter of 2024 – Minesite costs per tonne increased when compared to the prior-year period due to higher royalty costs, partially offset by the higher volume of ore milled in the current period. Total cash costs per ounce decreased when compared to the prior-year period due to more ounces of gold produced in the current period
- Full Year 2024 – Minesite costs per tonne decreased when compared to the prior year due to the higher volume of ore milled in the current period. Total cash costs per ounce increased when compared to the prior year due to the same reasons as for the higher production costs per ounce
Highlights
- In the fourth quarter of 2024, Macassa achieved record quarterly throughput and gold production. This performance reflects the productivity gains achieved at the mine and mill over several quarters since the completion of the #4 Shaft and the new ventilation infrastructure in 2023. The Company has transitioned its focus from optimizing the mine to the mill and is working on several initiatives such as improving the ore grind classification and load in the grinding circuit to further improve mill throughput
- The higher gold production than forecast was also driven by higher gold grades in the quarter primarily due to better than expected ore extraction in priority production headings
- Construction of the new paste plant was 87% complete as at December 31, 2024 and is on schedule for commissioning in the first half of 2025
NUNAVUT
Meliadine – Two Million Ounce Milestone Achieved; Strong Quarterly Gold Production Driven by Record Ore Hauling and Strong Mill Throughput
| Meliadine – Operating Statistics | Three Months Ended December 31, | Year Ended December 31, | ||||||
| 2024 | 2023 | 2024 | 2023 | |||||
| Tonnes of ore milled (thousands of tonnes) | 516 | 511 | 1,966 | 1,918 | ||||
| Tonnes of ore milled per day | 5,609 | 5,554 | 5,372 | 5,255 | ||||
| Gold grade (g/t) | 5.89 | 6.03 | 6.22 | 6.11 | ||||
| Gold production (ounces) | 94,648 | 96,285 | 378,886 | 364,141 | ||||
| Production costs per tonne (C$) | C$ 257 | C$ 251 | C$ 243 | C$ 241 | ||||
| Minesite costs per tonne (C$) | C$ 263 | C$ 249 | C$ 247 | C$ 249 | ||||
| Production costs per ounce | $ 1,012 | $ 981 | $ 924 | $ 944 | ||||
| Total cash costs per ounce | $ 1,037 | $ 992 | $ 940 | $ 980 |
Gold Production
- Fourth Quarter of 2024 – Gold production decreased when compared to the prior-year period primarily due to lower gold grades from the mining sequence, partially offset by higher throughput as a result of the commissioning of the Phase 2 mill expansion
- Full Year 2024 – Gold production increased when compared to the prior year primarily due to higher throughput and higher gold grades as expected from the mining sequence
Production Costs
- Fourth Quarter of 2024 – Production costs per tonne increased when compared to the prior-year period primarily due to higher underground services and royalty costs. Production costs per ounce increased when compared to the prior-year period due to the same reasons outlined above for production costs per tonne and fewer gold ounces produced in the current period
- Full Year 2024 – Production costs per tonne increased when compared to the prior year primarily due to higher underground services and royalty costs, partially offset by a higher volume of ore milled in the current period. Production costs per ounce decreased in the current period due to more ounces of gold being produced in the current period, partially offset by the same reasons outlined above for higher production costs per tonne
Minesite and Total Cash Costs
- Fourth Quarter of 2024 – Minesite costs per tonne increased when compared to the prior-year period for the same reasons outlined above for the higher production costs per tonne. Total cash costs per ounce increased when compared to the prior-year period for the same reasons outlined above for the production costs per ounce
- Full Year 2024 – Minesite costs per tonne decreased when compared to the prior year primarily due to the higher volume of ore milled. Total cash costs per ounce decreased when compared to the prior year primarily due to the same reasons outlined above for production costs per ounce
Highlights
- In November 2024, Meliadine achieved the significant milestone of two million ounces of gold poured since the mine began production
- Gold production in the fourth quarter of 2024 was in line with plan as a result of strong underground mine and mill performance but offset by lower grades due to mine sequencing. The underground mine performance was driven by record quarterly hauling and development, as a result of ongoing optimization projects at Meliadine, including the transition from 10-hour to 12-hour shifts underground. At the mill, throughput continued to ramp up during the fourth quarter reaching the target rate of 6,000 tpd in December
- During the first quarter of 2024, the Company submitted a proposal to the Nunavut Water Board (“NWB”) to amend the current Type A Water license to include tailings, water and waste management infrastructure at the Pump, F-zone, Wesmeg and Discovery deposits. The amendment to the water license received a positive recommendation from the NWB in October 2024 and received Ministry approval during the fourth quarter of 2024
Meadowbank – Record Annual Production; Solid Quarterly Gold Production with Ore Tonnes in Line with Plan Despite Challenging Weather Conditions
| Meadowbank – Operating Statistics | Three Months Ended December 31, | Year Ended December 31, | ||||||
| 2024 | 2023 | 2024 | 2023 | |||||
| Tonnes of ore milled (thousands of tonnes) | 999 | 938 | 4,143 | 3,843 | ||||
| Tonnes of ore milled per day | 10,859 | 10,196 | 11,320 | 10,529 | ||||
| Gold grade (g/t) | 4.07 | 3.97 | 4.18 | 3.86 | ||||
| Gold production (ounces) | 117,024 | 109,226 | 504,719 | 431,666 | ||||
| Production costs per tonne (C$) | C$ 154 | C$ 206 | C$ 153 | C$ 183 | ||||
| Minesite costs per tonne (C$) | C$ 161 | C$ 185 | C$ 156 | C$ 179 | ||||
| Production costs per ounce | $ 945 | $ 1,306 | $ 918 | $ 1,214 | ||||
| Total cash costs per ounce | $ 988 | $ 1,186 | $ 938 | $ 1,176 |
Gold Production
- Fourth Quarter of 2024 – Gold production increased when compared to the prior-year period primarily due to higher throughput and higher gold grades as expected under the mine sequence, partially offset by lower recovery
- Full Year 2024 – Gold production increased when compared to the prior year primarily due to higher gold grades as expected under the mine sequence and higher throughput, as the comparative period was affected by unplanned downtime at the SAG mill and unplanned shutdowns of the Amaruq to Meadowbank road due to caribou migration patterns
Production Costs
- Fourth Quarter and Full Year 2024 – Production costs per tonne decreased when compared to the prior-year periods due to a higher volume of ore milled and a build-up in stockpiles, partially offset by higher royalty costs. Production costs per ounce decreased when compared to the prior-year periods due to the same reasons outlined above for lower production costs per tonne and more ounces of gold being produced in the current period
Minesite and Total Cash Costs
- Fourth Quarter and Full Year 2024 – Minesite costs per tonne decreased when compared to the prior-year periods due to the same reasons as for the lower production costs per tonne. Total cash costs per ounce decreased when compared to the prior-year periods due to the same reasons outlined above for the lower production costs per ounce
Highlights
- Gold production was lower quarter-over-quarter primarily due to lower grades as a result of mine sequencing
- Ore tonnes from both open pit and underground operations were in line with forecast despite challenging conditions with heavy rainfall in October, which affected haulage productivity. The steady mine performance is a result of the productivity gains achieved through the full mining cycle and increased adherence and compliance to plan in 2024. Production also continues to benefit from positive reconciliation on ore tonnage
AUSTRALIA
Fosterville – Production at Robbins Hill Commences; Record Annual Underground Tonnes Mined
| Fosterville – Operating Statistics | Three Months Ended December 31, | Year Ended December 31, | ||||||
| 2024 | 2023 | 2024 | 2023 | |||||
| Tonnes of ore milled (thousands of tonnes) | 158 | 183 | 810 | 651 | ||||
| Tonnes of ore milled per day | 1,717 | 1,989 | 2,213 | 1,784 | ||||
| Gold grade (g/t) | 7.65 | 8.79 | 8.96 | 13.61 | ||||
| Gold production (ounces) | 37,139 | 49,533 | 225,203 | 277,694 | ||||
| Production costs per tonne (A$) | A$ 319 | A$ 259 | A$ 277 | A$ 304 | ||||
| Minesite costs per tonne (A$) | A$ 325 | A$ 261 | A$ 276 | A$ 301 | ||||
| Production costs per ounce | $ 868 | $ 632 | $ 653 | $ 473 | ||||
| Total cash costs per ounce | $ 878 | $ 723 | $ 647 | $ 488 |
Gold Production
- Fourth Quarter of 2024 – Gold production decreased when compared to the prior-year period primarily due to lower throughput and lower gold grades when compared to the prior period as the ultra-high grade Swan zone is depleting in line with the mine plan
- Full Year 2024 – Gold production decreased when compared to the prior year primarily due to lower grades as the ultra-high grade Swan zone is depleting in line with the mine plan, partially offset by the higher throughput
Production Costs
- Fourth Quarter of 2024 – Production costs per tonne increased when compared to the prior-year period primarily due to higher mining and milling costs and a lower volume of ore milled in the period. Production costs per ounce increased when compared to the prior-year period due to lower gold grades in the period
- Full Year 2024 – Production costs per tonne decreased when compared to the prior year primarily due to a higher volume of ore milled in the period, partially offset by higher mining and milling costs. Production costs per ounce increased when compared to the prior year due to lower gold grades in the period
Minesite and Total Cash Costs
- Fourth Quarter of 2024 – Minesite costs per tonne increased when compared to the prior-year period due to the same reasons as for the higher production costs per tonne. Total cash costs per ounce increased when compared to the prior-year period due to the same reasons outlined above for higher production costs per ounce
- Full Year 2024 – Minesite costs per tonne decreased when compared to the prior year due to the same reasons as for the lower production costs per tonne. Total cash costs per ounce increased when compared to the prior year due to the same reasons outlined above for higher production costs per ounce
Highlights
- Gold production in the fourth quarter of 2024 was affected by a 3.4 Mw (Moment Magnitude) seismic event in November 2024, which caused damage to the underground infrastructure in the Lower Phoenix area. Rehabilitation work is ongoing and a phased approach has been adopted to resume development and production, which is expected to be completed in the first quarter of 2025. The Company continues to adjust the mining methods, ground support and protocols to address seismic activity in the deeper portions of the mine
- During the fourth quarter, production from Robbins Hill commenced with the first stope mined in November. The Robbins Hill area, along with Cygnet area, are expected to provide increased production flexibility at Fosterville. The Company continues to focus on productivity gains and cost control at the mine and the mill to maximize throughput and reduce unit costs as gold grades continue to decline with the depletion of the Swan zone
- The Company is currently advancing an upgrade of the primary ventilation system to sustain the mining rate in the Lower Phoenix zones in future years. In the fourth quarter of 2024, raise boring was completed and the project is progressing as planned at approximately 92% completion. The Company expects the project to be completed in the first quarter of 2025
FINLAND
Kittila – Completion of Autoclave Maintenance; Recovery Improvement Initiatives Ongoing
| Kittila – Operating Statistics | Three Months Ended December 31, | Year Ended December 31, | ||||||
| 2024 | 2023 | 2024 | 2023 | |||||
| Tonnes of ore milled (thousands of tonnes) | 476 | 514 | 2,026 | 1,954 | ||||
| Tonnes of ore milled per day | 5,174 | 5,587 | 5,536 | 5,353 | ||||
| Gold grade (g/t) | 4.15 | 4.55 | 4.11 | 4.48 | ||||
| Gold production (ounces) | 51,893 | 61,172 | 218,860 | 234,402 | ||||
| Production costs per tonne (€) | € 100 | € 91 | € 103 | € 98 | ||||
| Minesite costs per tonne (€) | € 106 | € 96 | € 103 | € 99 | ||||
| Production costs per ounce | $ 979 | $ 828 | $ 1,039 | $ 878 | ||||
| Total cash costs per ounce | $ 1,026 | $ 858 | $ 1,031 | $ 871 |
Gold Production
- Fourth Quarter of 2024 – Gold production decreased when compared to the prior-year period primarily due to lower gold grades and lower throughput as the Company completed a 10-day planned maintenance of the autoclave in the fourth quarter of 2024
- Full Year 2024 – Gold production decreased when compared to the prior year primarily due to lower gold grades, partially offset by higher throughput
Production Costs
- Fourth Quarter of 2024 – Production costs per tonne increased when compared to the prior-year period primarily due to higher mill maintenance and royalty costs and a lower volume of ore milled in the current period. Production costs per ounce increased when compared to the prior-year period due to the same reasons outlined above and fewer ounces of gold being produced in the current period
- Full Year 2024 – Production costs per tonne increased when compared to the prior year primarily due to higher underground mining and maintenance costs, higher milling and royalty costs, partially offset by a higher volume of ore milled in the current period. Production costs per ounce increased when compared to the prior year due to the same reasons outlined above for higher production costs per tonne and fewer ounces of gold being produced in the current period
Minesite and Total Cash Costs
- Fourth Quarter of 2024 – Minesite costs per tonne increased when compared to the prior-year period due to the same reasons impacting the higher production costs per tonne. Total cash costs per ounce increased when compared to the prior-year period due to the same reasons impacting the higher production costs per ounce
- Full Year 2024 – Minesite costs per tonne increased when compared to the prior year due to the same reasons impacting the higher production costs per tonne. Total cash costs per ounce increased when compared to the prior year due to the same reasons impacting the higher production costs per ounce
Highlights
- Gold production in the fourth quarter was affected by a planned 10-day mill shutdown for autoclave and other mill maintenance in October 2024
- Gold production was also slightly lower than planned in the fourth quarter of 2024 due to lower recovery from higher carbon and sulphur content in the ore, partially offset by higher grades. Various recovery improvement actions continued to be implemented during the quarter, resulting in an improvement in recovery rates towards year-end 2024
MEXICO
Pinos Altos – Production Affected by Completion of Operations at the Reyna de Plata Open Pit
| Pinos Altos – Operating Statistics | Three Months Ended December 31, | Year Ended December 31, | ||||||
| 2024 | 2023 | 2024 | 2023 | |||||
| Tonnes of ore milled (thousands of tonnes) | 381 | 441 | 1,707 | 1,656 | ||||
| Tonnes of ore milled per day | 4,141 | 4,793 | 4,664 | 4,537 | ||||
| Gold grade (g/t) | 1.58 | 1.91 | 1.69 | 1.92 | ||||
| Gold production (ounces) | 18,583 | 25,963 | 88,433 | 97,642 | ||||
| Production costs per tonne | $ 119 | $ 87 | $ 99 | $ 88 | ||||
| Minesite costs per tonne | $ 115 | $ 88 | $ 99 | $ 88 | ||||
| Production costs per ounce | $ 2,435 | $ 1,470 | $ 1,902 | $ 1,495 | ||||
| Total cash costs per ounce | $ 1,921 | $ 1,210 | $ 1,530 | $ 1,229 |
Gold Production
- Fourth Quarter of 2024 – Gold production decreased when compared to the prior-year period primarily due to lower gold grades as expected from the mining sequence and lower throughput
- Full Year 2024 – Gold production decreased when compared to the prior year primarily due to lower grades as expected from the mining sequence and lower recovery, partially offset by higher throughput
Production Costs
- Fourth Quarter of 2024 – Production costs per tonne increased when compared to the prior-year period primarily due to higher mill maintenance and royalty costs and lower volume of ore milled in the current period. Production costs per ounce increased when compared to the prior-year period for the same reasons outlined above for production costs per tonne and fewer ounces of gold produced in the current period
- Full Year 2024 – Production costs per tonne increased when compared to the prior year primarily due to higher underground mining and maintenance costs, and higher milling and royalty costs, partially offset by the higher volume of ore milled in the current period. Production costs per ounce increased when compared to the prior year due to the same reasons outlined above for the higher production costs per tonne and fewer ounces of gold produced in the period
Minesite and Total Cash Costs
- Fourth Quarter of 2024 – Minesite costs per tonne increased when compared to the prior-year period due to the same reasons outlined above for the higher production costs per tonne. Total cash costs per ounce increased when compared to the prior-year period due to the same reasons outlined above that resulted in higher production costs per ounce
- Full Year 2024 – Minesite costs per tonne increased when compared to the prior year due to the same reasons as the higher production costs per tonne. Total cash costs per ounce increased when compared to the prior year due to the same reasons as the higher production costs per ounce
La India – Residual Leaching Activities Completed with Pre-Closure Activities Ongoing
| La India – Operating Statistics | Three Months Ended December 31, | Year Ended December 31, | ||||||
| 2024 | 2023 | 2024 | 2023 | |||||
| Tonnes of ore milled (thousands of tonnes) | — | 500 | — | 3,010 | ||||
| Tonnes of ore milled per day | — | 5,435 | — | 8,247 | ||||
| Gold grade (g/t) | — | 0.92 | — | 0.87 | ||||
| Gold production (ounces) | 3,390 | 19,481 | 24,580 | 75,904 | ||||
| Production costs per tonne | $ — | $ 49 | $ — | $ 32 | ||||
| Minesite costs per tonne | $ — | $ 45 | $ — | $ 32 | ||||
| Production costs per ounce | $ 3,045 | $ 1,254 | $ 2,025 | $ 1,271 | ||||
| Total cash costs per ounce | $ 1,835 | $ 1,149 | $ 1,945 | $ 1,241 |
Gold Production
- Fourth Quarter and Full Year 2024 – Gold production decreased when compared to the prior-year periods due to ceasing of mining operations at La India in the fourth quarter of 2023. Gold production in the current periods came only from residual leaching
Costs
- Fourth Quarter and Full Year 2024 – Production costs per ounce and total cash costs per ounce increased when compared to the prior-year periods primarily due to fewer ounces of gold being produced due to the cessation of mining activities
About Agnico Eagle
Agnico Eagle is a Canadian based and led senior gold mining company and the third largest gold producer in the world, producing precious metals from operations in Canada, Australia, Finland and Mexico, with a pipeline of high-quality exploration and development projects. Agnico Eagle is a partner of choice within the mining industry, recognized globally for its leading sustainability practices. Agnico Eagle was founded in 1957 and has consistently created value for its shareholders, declaring a cash dividend every year since 1983.
About this News Release
Unless otherwise stated, references to “LaRonde”, “Canadian Malartic”, “Meadowbank” and “Goldex” are to the Company’s operations at the LaRonde complex, the Canadian Malartic complex, the Meadowbank complex and the Goldex complex, respectively. The LaRonde complex consists of the mining, milling and processing operations at the LaRonde mine and the mining operations at the LaRonde Zone 5 mine. The Canadian Malartic complex consists of the milling and processing operations at the Canadian Malartic mine and the mining operations at the Odyssey mine. The Meadowbank complex consists of the mining, milling and processing operations at the Meadowbank mine and the Amaruq open pit and underground mines. The Goldex complex consists of the mining, milling and processing operations at the Goldex mine and the mining operations at the Akasaba West open pit mine. References to other operations are to the relevant mines, projects or properties, as applicable.
When used in this news release, the terms “including” and “such as” mean including and such as, without limitation.
The information contained on any website linked to or referred to herein (including the Company’s website) is not part of this news release.
Further Information
For further information regarding Agnico Eagle, contact Investor Relations at investor.relations@agnicoeagle.com or call (416) 947-1212.
Note Regarding Certain Measures of Performance
This news release discloses certain financial performance measures and ratios, including “total cash costs per ounce”, “minesite costs per tonne”, “all-in sustaining costs per ounce” (or “AISC per ounce”), “adjusted net income”, “adjusted net income per share”, “cash provided by operating activities before changes in non-cash working capital balances”, “cash provided by operating activities before changes in non-cash working capital balances per share”, “EBITDA” which means earnings before interest, taxes, depreciation and amortization, “adjusted EBITDA”, “free cash flow”, “free cash flow before changes in non-cash working capital balances”, “operating margin”, “sustaining capital expenditures”, “development capital expenditures”, “sustaining capitalized exploration”, “development capitalized exploration” and “net debt”, as well as, for certain of these measures their related per share ratios that are not standardized measures under IFRS. These measures may not be comparable to similar measures reported by other gold producers and should be considered together with other data prepared in accordance with IFRS. See below for a reconciliation of these measures to the most directly comparable financial information reported in the consolidated financial statements prepared in accordance with IFRS.
Total cash costs per ounce and minesite costs per tonne
Total cash costs per ounce is calculated on a per ounce of gold produced basis and is reported on both a by-product basis (deducting by-product metal revenues from production costs) and co-product basis (without deducting by-product metal revenues). Total cash costs per ounce on a by-product basis is calculated by adjusting production costs as recorded in the consolidated statements of income for by-product revenues, inventory production costs, the impact of purchase price allocation in connection with mergers and acquisitions on inventory accounting, realized gains and losses on hedges of production costs and other adjustments, which include the costs associated with a 5% in-kind royalty paid in respect of certain portions of Canadian Malartic, a 2% in-kind royalty paid in respect of Detour Lake, a 1.5% in-kind royalty paid in respect of Macassa, as well as smelting, refining and marketing charges and then dividing by the number of ounces of gold produced. Given the nature of the fair value adjustment on inventory related to mergers and acquisitions and the use of the total cash costs per ounce measures to reflect the cash generating capabilities of the Company’s operations, the calculation of total cash costs per ounce for Canadian Malartic has been adjusted for the purchase price allocation in the comparative period data. Investors should note that total cash costs per ounce is not reflective of all cash expenditures, as it does not include income tax payments, interest costs or dividend payments. Total cash costs per ounce on a co-product basis is calculated in the same manner as total cash costs per ounce on a by-product basis, except that no adjustment is made for by-product metal revenues. Accordingly, the calculation of total cash costs per ounce on a co-product basis does not reflect a reduction in production costs or smelting, refining and marketing charges associated with the production and sale of by-product metals.
Total cash costs per ounce is intended to provide investors information about the cash-generating capabilities of the Company’s mining operations. Management also uses these measures to, and believes they are useful to investors so investors can, understand and monitor the performance of the Company’s mining operations. The Company believes that total cash costs per ounce is useful to help investors understand the costs associated with producing gold and the economics of gold mining. As market prices for gold are quoted on a per ounce basis, using the total cash costs per ounce on a by-product basis measure allows management and investors to assess a mine’s cash-generating capabilities at various gold prices. Management is aware, and investors should note, that these per ounce measures of performance can be affected by fluctuations in exchange rates and, in the case of total cash costs per ounce on a by-product basis, by-product metal prices. Management compensates for these inherent limitations by, and investors should also consider, using these measures in conjunction with data prepared in accordance with IFRS and minesite costs per tonne as these measures are not necessarily indicative of operating costs or cash flow measures prepared in accordance with IFRS. Management also performs sensitivity analyses in order to quantify the effects of fluctuating metal prices and exchange rates.
Agnico Eagle’s primary business is gold production and the focus of its current operations and future development is on maximizing returns from gold production, with other metal production being incidental to the gold production process. Accordingly, all metals other than gold are considered by-products.
Unless otherwise indicated, total cash costs per ounce is reported on a by-product basis. Total cash costs per ounce is reported on a by-product basis because (i) the majority of the Company’s revenues are from gold, (ii) the Company mines ore, which contains gold, silver, zinc, copper and other metals, (iii) it is not possible to specifically assign all costs to revenues from the gold, silver, zinc, copper and other metals the Company produces, (iv) it is a method used by management and the Board of Directors to monitor operations, and (v) many other gold producers disclose similar measures on a by-product rather than a co-product basis.
Minesite costs per tonne are calculated by adjusting production costs as recorded in the consolidated statements of income for inventory production costs and other adjustments, and then dividing by tonnage of ore processed. As the total cash costs per ounce can be affected by fluctuations in by‑product metal prices and foreign exchange rates, management believes that minesite costs per tonne is useful to investors in providing additional information regarding the performance of mining operations, eliminating the impact of varying production levels. Management also uses this measure to determine the economic viability of mining blocks. As each mining block is evaluated based on the net realizable value of each tonne mined, in order to be economically viable the estimated revenue on a per tonne basis must be in excess of the minesite costs per tonne. Management is aware, and investors should note, that this per tonne measure of performance can be affected by fluctuations in processing levels. This inherent limitation may be partially mitigated by using this measure in conjunction with production costs and other data prepared in accordance with IFRS.
The following tables set out a reconciliation of total cash costs per ounce and minesite costs per tonne to production costs, exclusive of amortization, for the three and twelve months ended December 31, 2024 and December 31, 2023, as presented in the consolidated statements of income in accordance with IFRS.
| Total Production Costs by Mine | |||||||
| Three Months EndedDecember 31, | Year Ended December 31, | ||||||
| (thousands of United States dollars) | 2024 | 2023 | 2024 | 2023 | |||
| Quebec | |||||||
| LaRonde mine | $ 45,827 | $ 47,867 | $ 239,309 | $ 218,020 | |||
| LZ5 | 22,127 | 18,922 | 80,186 | 81,624 | |||
| LaRonde | 67,954 | 66,789 | 319,495 | 299,644 | |||
| Canadian Malartic(i) | 132,144 | 138,878 | 532,037 | 465,814 | |||
| Goldex | 29,446 | 27,222 | 129,977 | 112,022 | |||
| Ontario | |||||||
| Detour Lake | 117,713 | 120,284 | 497,079 | 453,498 | |||
| Macassa | 54,608 | 42,678 | 201,371 | 155,046 | |||
| Nunavut | |||||||
| Meliadine | 95,817 | 94,429 | 350,280 | 343,650 | |||
| Meadowbank | 110,583 | 142,597 | 463,464 | 524,008 | |||
| Australia | |||||||
| Fosterville | 32,221 | 31,329 | 147,045 | 131,298 | |||
| Europe | |||||||
| Kittila | 50,799 | 50,657 | 227,334 | 205,857 | |||
| Mexico | |||||||
| Pinos Altos | 45,251 | 38,158 | 168,231 | 145,936 | |||
| La India | 10,322 | 24,434 | 49,767 | 96,490 | |||
| Production costs per the consolidated statements of income | $ 746,858 | $ 777,455 | $ 3,086,080 | $ 2,933,263 |
| Reconciliation of Production Costs to Total Cash Costs per Ounce by Mine and Reconciliation of Production Costs to Minesite Costs per Tonne by Mine | |||||||||||
| (thousands of United States dollars, except as noted) | |||||||||||
| LaRonde mine(per ounce) | Three Months EndedDecember 31, | Year EndedDecember 31, | |||||||||
| 2024 | 2023 | 2024 | 2023 | ||||||||
| Gold production (ounces) | 66,124 | 68,520 | 227,512 | 235,991 | |||||||
| (thousands) | ($ per ounce) | (thousands) | ($ per ounce) | (thousands) | ($ per ounce) | (thousands) | ($ per ounce) | ||||
| Production costs | $ 45,827 | $ 693 | $ 47,867 | $ 699 | $ 239,309 | $ 1,052 | $ 218,020 | $ 924 | |||
| Inventory adjustments(ii) | 18,617 | 282 | 16,114 | 235 | 5,725 | 25 | 13,448 | 57 | |||
| Realized gains and losses on hedges of production costs | 748 | 11 | 801 | 12 | 1,364 | 6 | 2,966 | 13 | |||
| Other adjustments(v) | 2,966 | 45 | 3,397 | 49 | 12,201 | 54 | 17,478 | 73 | |||
| Total cash costs(co-product basis) | $ 68,158 | $ 1,031 | $ 68,179 | $ 995 | $ 258,599 | $ 1,137 | $ 251,912 | $ 1,067 | |||
| By-product metal revenues | (16,562) | (251) | (12,378) | (181) | (56,265) | (248) | (53,694) | (227) | |||
| Total cash costs(by-product basis) | $ 51,596 | $ 780 | $ 55,801 | $ 814 | $ 202,334 | $ 889 | $ 198,218 | $ 840 | |||
| LaRonde mine(per tonne) | Three Months EndedDecember 31, | Year EndedDecember 31, | |||||||||
| 2024 | 2023 | 2024 | 2023 | ||||||||
| Tonnes of ore milled (thousands) | 405 | 400 | 1,554 | 1,501 | |||||||
| (thousands) | ($ per tonne) | (thousands) | ($ per tonne) | (thousands) | ($ per tonne) | (thousands) | ($ per tonne) | ||||
| Production costs | $ 45,827 | $ 113 | $ 47,867 | $ 120 | $ 239,309 | $ 154 | $ 218,020 | $ 145 | |||
| Production costs (C$) | C$ 63,851 | C$ 158 | C$ 64,965 | C$ 162 | C$ 326,489 | C$ 210 | C$ 293,627 | C$ 196 | |||
| Inventory adjustments (C$)(iii) | 25,581 | 63 | 21,956 | 55 | 9,512 | 6 | 20,501 | 14 | |||
| Other adjustments (C$)(v) | (4,131) | (10) | (3,795) | (9) | (12,150) | (8) | (12,990) | (9) | |||
| Minesite costs (C$) | C$ 85,301 | C$ 211 | C$ 83,126 | C$ 208 | C$ 323,851 | C$ 208 | C$ 301,138 | C$ 201 | |||
| LZ5(per ounce) | Three Months EndedDecember 31, | Year EndedDecember 31, | |||||||||
| 2024 | 2023 | 2024 | 2023 | ||||||||
| Gold production (ounces) | 24,323 | 17,245 | 79,238 | 70,657 | |||||||
| (thousands) | ($ per ounce) | (thousands) | ($ per ounce) | (thousands) | ($ per ounce) | (thousands) | ($ per ounce) | ||||
| Production costs | $ 22,127 | $ 910 | $ 18,922 | $ 1,097 | $ 80,186 | $ 1,012 | $ 81,624 | $ 1,155 | |||
| Inventory adjustments(ii) | 735 | 30 | (3,367) | (195) | 4,555 | 58 | (3,494) | (49) | |||
| Realized gains and losses on hedges of production costs | 261 | 11 | 266 | 15 | 476 | 6 | 988 | 14 | |||
| Other adjustments(v) | 955 | 39 | 841 | 49 | 3,351 | 42 | 2,705 | 38 | |||
| Total cash costs(co-product basis) | $ 24,078 | $ 990 | $ 16,662 | $ 966 | $ 88,568 | $ 1,118 | $ 81,823 | $ 1,158 | |||
| By-product metal revenues | (250) | (10) | (13) | (1) | (1,022) | (13) | (711) | (10) | |||
| Total cash costs(by-product basis) | $ 23,828 | $ 980 | $ 16,649 | $ 965 | $ 87,546 | $ 1,105 | $ 81,112 | $ 1,148 | |||
| LZ5(per tonne) | Three Months EndedDecember 31, | Year EndedDecember 31, | |||||||||
| 2024 | 2023 | 2024 | 2023 | ||||||||
| Tonnes of ore milled (thousands) | 397 | 263 | 1,295 | 1,157 | |||||||
| (thousands) | ($ per tonne) | (thousands) | ($ per tonne) | (thousands) | ($ per tonne) | (thousands) | ($ per tonne) | ||||
| Production costs | $ 22,127 | $ 56 | $ 18,922 | $ 72 | $ 80,186 | $ 62 | $ 81,624 | $ 71 | |||
| Production costs (C$) | C$ 30,757 | C$ 78 | C$ 25,644 | C$ 98 | C$ 109,741 | C$ 85 | C$ 109,991 | C$ 95 | |||
| Inventory adjustments (C$)(iii) | 1,230 | 3 | (4,542) | (18) | 6,422 | 5 | (4,717) | (4) | |||
| Minesite costs (C$) | C$ 31,987 | C$ 81 | C$ 21,102 | C$ 80 | C$ 116,163 | C$ 90 | C$ 105,274 | C$ 91 | |||
| LaRonde(per ounce) | Three Months EndedDecember 31, | Year EndedDecember 31, | |||||||||
| 2024 | 2023 | 2024 | 2023 | ||||||||
| Gold production (ounces) | 90,447 | 85,765 | 306,750 | 306,648 | |||||||
| (thousands) | ($ per ounce) | (thousands) | ($ per ounce) | (thousands) | ($ per ounce) | (thousands) | ($ per ounce) | ||||
| Production costs | $ 67,954 | $ 751 | $ 66,789 | $ 779 | $ 319,495 | $ 1,042 | $ 299,644 | $ 977 | |||
| Inventory adjustments(ii) | 19,352 | 214 | 12,747 | 149 | 10,280 | 33 | 9,954 | 32 | |||
| Realized gains and losses on hedges of production costs | 1,009 | 11 | 1,067 | 12 | 1,840 | 6 | 3,954 | 13 | |||
| Other adjustments(v) | 3,921 | 44 | 4,238 | 49 | 15,552 | 51 | 20,183 | 66 | |||
| Total cash costs(co-product basis) | $ 92,236 | $ 1,020 | $ 84,841 | $ 989 | $ 347,167 | $ 1,132 | $ 333,735 | $ 1,088 | |||
| By-product metal revenues | (16,812) | (186) | (12,391) | (144) | (57,287) | (187) | (54,405) | (177) | |||
| Total cash costs(by-product basis) | $ 75,424 | $ 834 | $ 72,450 | $ 845 | $ 289,880 | $ 945 | $ 279,330 | $ 911 | |||
| LaRonde(per tonne) | Three Months EndedDecember 31, | Year EndedDecember 31, | |||||||||
| 2024 | 2023 | ||||||||||
| Tonnes of ore milled (thousands) | 802 | 663 | 2,849 | 2,658 | |||||||
| (thousands) | ($ per tonne) | (thousands) | ($ per tonne) | (thousands) | ($ per tonne) | (thousands) | ($ per tonne) | ||||
| Production costs | $ 67,954 | $ 85 | $ 66,789 | $ 101 | $ 319,495 | $ 112 | $ 299,644 | $ 113 | |||
| Production costs (C$) | C$ 94,608 | C$ 118 | C$ 90,609 | C$ 137 | C$ 436,230 | C$ 153 | C$ 403,618 | C$ 152 | |||
| Inventory adjustments (C$)(iii) | 26,811 | 33 | 17,414 | 26 | 15,934 | 5 | 15,784 | 6 | |||
| Other adjustments (C$)(v) | (4,131) | (5) | (3,795) | (6) | (12,150) | (4) | (12,990) | (5) | |||
| Minesite costs (C$) | C$ 117,288 | C$ 146 | C$ 104,228 | C$ 157 | C$ 440,014 | C$ 154 | C$ 406,412 | C$ 153 | |||
| Canadian Malartic(per ounce)(i) | Three Months EndedDecember 31, | Year EndedDecember 31, | |||||||||
| 2024 | 2023 | 2024 | 2023 | ||||||||
| Gold production (ounces) | 146,485 | 168,272 | 655,654 | 603,955 | |||||||
| (thousands) | ($ per ounce) | (thousands) | ($ per ounce) | (thousands) | ($ per ounce) | (thousands) | ($ per ounce) | ||||
| Production costs | $ 132,144 | $ 902 | $ 138,878 | $ 825 | $ 532,037 | $ 811 | $ 465,814 | $ 771 | |||
| Inventory adjustments(ii) | (9,044) | (62) | (2,794) | (17) | (1,968) | (3) | 4,738 | 8 | |||
| Realized gains and losses on hedges of production costs | 2,101 | 14 | — | — | 4,138 | 6 | — | — | |||
| Purchase price allocation to inventory(iv) | 5,771 | 39 | — | — | 5,771 | 9 | (26,447) | (44) | |||
| In-kind royalties and other adjustments(v) | 19,938 | 137 | 19,518 | 117 | 78,230 | 120 | 60,149 | 100 | |||
| Total cash costs(co-product basis) | $ 150,910 | $ 1,030 | $ 155,602 | $ 925 | $ 618,208 | $ 943 | $ 504,254 | $ 835 | |||
| By-product metal revenues | (2,441) | (16) | (1,974) | (12) | (8,386) | (13) | (6,732) | (11) | |||
| Total cash costs(by-product basis) | $ 148,469 | $ 1,014 | $ 153,628 | $ 913 | $ 609,822 | $ 930 | $ 497,522 | $ 824 | |||
| Canadian Malartic(per tonne)(i) | Three Months EndedDecember 31, | Year EndedDecember 31, | |||||||||
| 2024 | 2023 | 2024 | 2023 | ||||||||
| Tonnes of ore milled (thousands) | 5,100 | 5,278 | 20,317 | 17,333 | |||||||
| (thousands) | ($ per tonne) | (thousands) | ($ per tonne) | (thousands) | ($ per tonne) | (thousands) | ($ per tonne) | ||||
| Production costs | $ 132,144 | $ 26 | $ 138,878 | $ 26 | $ 532,037 | $ 26 | $ 465,814 | $ 27 | |||
| Production costs (C$) | C$ 183,826 | C$ 36 | C$ 187,945 | C$ 36 | C$ 726,836 | C$ 36 | C$ 627,946 | C$ 36 | |||
| Inventory adjustments (C$)(iii) | (11,855) | (2) | (3,901) | (1) | (2,025) | — | 6,919 | — | |||
| Purchase price allocation to inventory (C$)(iv) | 8,073 | 2 | — | — | 8,073 | — | (34,555) | (2) | |||
| In-kind royalties and other adjustments (C$)(v) | 27,919 | 5 | 26,457 | 5 | 106,163 | 5 | 79,962 | 5 | |||
| Minesite costs (C$) | C$ 207,963 | C$ 41 | C$ 210,501 | C$ 40 | C$ 839,047 | C$ 41 | C$ 680,272 | C$ 39 | |||
| Goldex(per ounce) | Three Months EndedDecember 31, | Year EndedDecember 31, | |||||||||
| 2024 | 2023 | 2024 | 2023 | ||||||||
| Gold production (ounces) | 32,341 | 33,364 | 130,813 | 140,983 | |||||||
| (thousands) | ($ per ounce) | (thousands) | ($ per ounce) | (thousands) | ($ per ounce) | (thousands) | ($ per ounce) | ||||
| Production costs | $ 29,446 | $ 910 | $ 27,222 | $ 816 | $ 129,977 | $ 994 | $ 112,022 | $ 795 | |||
| Inventory adjustments(ii) | 2,920 | 90 | 1,666 | 50 | 2,438 | 18 | 1,650 | 11 | |||
| Realized gains and losses on hedges of production costs | 447 | 14 | 525 | 16 | 816 | 6 | 1,944 | 14 | |||
| Other adjustments(v) | 1,050 | 33 | 187 | 5 | 3,009 | 23 | 336 | 2 | |||
| Total cash costs(co-product basis) | $ 33,863 | $ 1,047 | $ 29,600 | $ 887 | $ 136,240 | $ 1,041 | $ 115,952 | $ 822 | |||
| By-product metal revenues | (6,093) | (188) | (340) | (10) | (15,452) | (118) | (378) | (2) | |||
| Total cash costs(by-product basis) | $ 27,770 | $ 859 | $ 29,260 | $ 877 | $ 120,788 | $ 923 | $ 115,574 | $ 820 | |||
| Goldex(per tonne) | Three Months EndedDecember 31, | Year EndedDecember 31, | |||||||||
| 2024 | 2023 | 2024 | 2023 | ||||||||
| Tonnes of ore milled (thousands) | 812 | 672 | 3,076 | 2,887 | |||||||
| (thousands) | ($ per tonne) | (thousands) | ($ per tonne) | (thousands) | ($ per tonne) | (thousands) | ($ per tonne) | ||||
| Production costs | $ 29,446 | $ 36 | $ 27,222 | $ 40 | $ 129,977 | $ 42 | $ 112,022 | $ 39 | |||
| Production costs (C$) | C$ 41,201 | C$ 51 | C$ 37,043 | C$ 55 | C$ 177,816 | C$ 58 | C$ 151,185 | C$ 52 | |||
| Inventory adjustments (C$)(iii) | 4,282 | 5 | 2,224 | 3 | 3,702 | 1 | 2,189 | 1 | |||
| Minesite costs (C$) | C$ 45,483 | C$ 56 | C$ 39,267 | C$ 58 | C$ 181,518 | C$ 59 | C$ 153,374 | C$ 53 | |||
| Detour Lake(per ounce) | Three Months EndedDecember 31, | Year EndedDecember 31, | |||||||||
| 2024 | 2023 | 2024 | 2023 | ||||||||
| Gold production (ounces) | 179,061 | 193,475 | 671,950 | 677,446 | |||||||
| (thousands) | ($ per ounce) | (thousands) | ($ per ounce) | (thousands) | ($ per ounce) | (thousands) | ($ per ounce) | ||||
| Production costs | $ 117,713 | $ 657 | $ 120,284 | $ 622 | $ 497,079 | $ 740 | $ 453,498 | $ 669 | |||
| Inventory adjustments(ii) | 5,947 | 33 | 4,695 | 24 | (1,348) | (2) | 8,232 | 12 | |||
| Realized gains and losses on hedges of production costs | 2,320 | 13 | 302 | 2 | 4,714 | 7 | 4,867 | 8 | |||
| In-kind royalties and other adjustments(v) | 10,195 | 58 | 9,101 | 47 | 37,788 | 56 | 33,149 | 49 | |||
| Total cash costs(co-product basis) | $ 136,175 | $ 761 | $ 134,382 | $ 695 | $ 538,233 | $ 801 | $ 499,746 | $ 738 | |||
| By-product metal revenues | (1,046) | (6) | (598) | (4) | (3,049) | (5) | (2,073) | (3) | |||
| Total cash costs(by-product basis) | $ 135,129 | $ 755 | $ 133,784 | $ 691 | $ 535,184 | $ 796 | $ 497,673 | $ 735 | |||
| Detour Lake(per tonne) | Three Months EndedDecember 31, | Year EndedDecember 31, | |||||||||
| 2024 | 2023 | 2024 | 2023 | ||||||||
| Tonnes of ore milled (thousands) | 7,086 | 6,608 | 27,462 | 25,435 | |||||||
| (thousands) | ($ per tonne) | (thousands) | ($ per tonne) | (thousands) | ($ per tonne) | (thousands) | ($ per tonne) | ||||
| Production costs | $ 117,713 | $ 17 | $ 120,284 | $ 18 | $ 497,079 | $ 18 | $ 453,498 | $ 18 | |||
| Production costs (C$) | C$ 163,506 | C$ 23 | C$ 163,230 | C$ 25 | C$ 678,877 | C$ 25 | C$ 611,244 | C$ 24 | |||
| Inventory adjustments (C$)(iii) | 9,164 | 1 | 6,291 | 1 | (458) | — | 11,038 | — | |||
| In-kind royalties and other adjustments (C$)(v) | 13,587 | 2 | 10,838 | 1 | 44,125 | 1 | 39,323 | 2 | |||
| Minesite costs (C$) | C$ 186,257 | C$ 26 | C$ 180,359 | C$ 27 | C$ 722,544 | C$ 26 | C$ 661,605 | C$ 26 | |||
| Macassa(per ounce) | Three Months EndedDecember 31, | Year EndedDecember 31, | |||||||||
| 2024 | 2023 | 2024 | 2023 | ||||||||
| Gold production (ounces) | 76,336 | 60,584 | 279,384 | 228,535 | |||||||
| (thousands) | ($ per ounce) | (thousands) | ($ per ounce) | (thousands) | ($ per ounce) | (thousands) | ($ per ounce) | ||||
| Production costs | $ 54,608 | $ 715 | $ 42,678 | $ 704 | $ 201,371 | $ 721 | $ 155,046 | $ 678 | |||
| Inventory adjustments(ii) | (4,645) | (61) | 985 | 16 | (3,607) | (13) | 1,382 | 6 | |||
| Realized gains and losses on hedges of production costs | 920 | 12 | 844 | 14 | 1,679 | 6 | 3,127 | 14 | |||
| In-kind royalties and other adjustments(v) | 3,488 | 46 | 1,908 | 32 | 10,564 | 38 | 8,041 | 35 | |||
| Total cash costs(co-product basis) | $ 54,371 | $ 712 | $ 46,415 | $ 766 | $ 210,007 | $ 752 | $ 167,596 | $ 733 | |||
| By-product metal revenues | (358) | (4) | (166) | (3) | (1,020) | (4) | (649) | (2) | |||
| Total cash costs(by-product basis) | $ 54,013 | $ 708 | $ 46,249 | $ 763 | $ 208,987 | $ 748 | $ 166,947 | $ 731 | |||
| Macassa(per tonne) | Three Months EndedDecember 31, | Year EndedDecember 31, | |||||||||
| 2024 | 2023 | 2024 | 2023 | ||||||||
| Tonnes of ore milled (thousands) | 154 | 131 | 574 | 442 | |||||||
| (thousands) | ($ per tonne) | (thousands) | ($ per tonne) | (thousands) | ($ per tonne) | (thousands) | ($ per tonne) | ||||
| Production costs | $ 54,608 | $ 355 | $ 42,678 | $ 327 | $ 201,371 | $ 351 | $ 155,046 | $ 351 | |||
| Production costs (C$) | C$ 76,615 | C$ 498 | C$ 58,184 | C$ 445 | C$ 276,532 | C$ 482 | C$ 209,928 | C$ 475 | |||
| Inventory adjustments (C$)(iii) | (6,073) | (39) | 1,078 | 9 | (4,605) | (8) | 1,836 | 4 | |||
| In-kind royalties and other adjustments (C$)(v) | 4,595 | 30 | 2,472 | 19 | 13,896 | 24 | 10,517 | 24 | |||
| Minesite costs (C$) | C$ 75,137 | C$ 489 | C$ 61,734 | C$ 473 | C$ 285,823 | C$ 498 | C$ 222,281 | C$ 503 | |||
| Meliadine(per ounce) | Three Months EndedDecember 31, | Year EndedDecember 31, | |||||||||
| 2024 | 2023 | 2024 | 2023 | ||||||||
| Gold production (ounces) | 94,648 | 96,285 | 378,886 | 364,141 | |||||||
| (thousands) | ($ per ounce) | (thousands) | ($ per ounce) | (thousands) | ($ per ounce) | (thousands) | ($ per ounce) | ||||
| Production costs | $ 95,817 | $ 1,012 | $ 94,429 | $ 981 | $ 350,280 | $ 924 | $ 343,650 | $ 944 | |||
| Inventory adjustments(ii) | 822 | 9 | (620) | (6) | 3,279 | 9 | 11,898 | 33 | |||
| Realized gains and losses on hedges of production costs | 1,553 | 16 | 1,746 | 17 | 3,165 | 8 | 1,682 | 4 | |||
| Other adjustments(v) | 150 | 2 | 82 | 1 | 250 | 1 | 128 | — | |||
| Total cash costs(co-product basis) | $ 98,342 | $ 1,039 | $ 95,637 | $ 993 | $ 356,974 | $ 942 | $ 357,358 | $ 981 | |||
| By-product metal revenues | (210) | (2) | (153) | (1) | (860) | (2) | (630) | (1) | |||
| Total cash costs(by-product basis) | $ 98,132 | $ 1,037 | $ 95,484 | $ 992 | $ 356,114 | $ 940 | $ 356,728 | $ 980 | |||
| Meliadine(per tonne) | Three Months EndedDecember 31, | Year EndedDecember 31, | |||||||||
| 2024 | 2023 | 2024 | 2023 | ||||||||
| Tonnes of ore milled (thousands) | 516 | 511 | 1,966 | 1,918 | |||||||
| (thousands) | ($ per tonne) | (thousands) | ($ per tonne) | (thousands) | ($ per tonne) | (thousands) | ($ per tonne) | ||||
| Production costs | $ 95,817 | $ 186 | $ 94,429 | $ 185 | $ 350,280 | $ 178 | $ 343,650 | $ 179 | |||
| Production costs (C$) | C$ 133,149 | C$ 257 | C$ 128,156 | C$ 251 | C$ 478,335 | C$ 243 | C$ 462,052 | C$ 241 | |||
| Inventory adjustments (C$)(iii) | 2,854 | 6 | (863) | (2) | 6,578 | 4 | 16,188 | 8 | |||
| Minesite costs (C$) | C$ 136,003 | C$ 263 | C$ 127,293 | C$ 249 | C$ 484,913 | C$ 247 | C$ 478,240 | C$ 249 | |||
| Meadowbank(per ounce) | Three Months EndedDecember 31, | Year EndedDecember 31, | |||||||||
| 2024 | 2023 | 2024 | 2023 | ||||||||
| Gold production (ounces) | 117,024 | 109,226 | 504,719 | 431,666 | |||||||
| (thousands) | ($ per ounce) | (thousands) | ($ per ounce) | (thousands) | ($ per ounce) | (thousands) | ($ per ounce) | ||||
| Production costs | $ 110,583 | $ 945 | $ 142,597 | $ 1,306 | $ 463,464 | $ 918 | $ 524,008 | $ 1,214 | |||
| Inventory adjustments(ii) | 4,052 | 35 | (14,484) | (133) | 9,464 | 19 | (12,021) | (28) | |||
| Realized gains and losses on hedges of production costs | 2,122 | 18 | 2,297 | 21 | 4,624 | 9 | (1,205) | (3) | |||
| Other adjustments(v) | 5 | — | (69) | (1) | (41) | — | (19) | — | |||
| Total cash costs(co-product basis) | $ 116,762 | $ 998 | $ 130,341 | $ 1,193 | $ 477,511 | $ 946 | $ 510,763 | $ 1,183 | |||
| By-product metal revenues | (1,186) | (10) | (837) | (7) | (4,138) | (8) | (2,958) | (7) | |||
| Total cash costs(by-product basis) | $ 115,576 | $ 988 | $ 129,504 | $ 1,186 | $ 473,373 | $ 938 | $ 507,805 | $ 1,176 | |||
| Meadowbank(per tonne) | Three Months EndedDecember 31, | Year EndedDecember 31, | |||||||||
| 2024 | 2023 | 2024 | 2023 | ||||||||
| Tonnes of ore milled (thousands) | 999 | 938 | 4,143 | 3,843 | |||||||
| (thousands) | ($ per tonne) | (thousands) | ($ per tonne) | (thousands) | ($ per tonne) | (thousands) | ($ per tonne) | ||||
| Production costs | $ 110,583 | $ 111 | $ 142,597 | $ 152 | $ 463,464 | $ 112 | $ 524,008 | $ 136 | |||
| Production costs (C$) | C$ 154,295 | C$ 154 | C$ 192,897 | C$ 206 | C$ 632,661 | C$ 153 | C$ 702,879 | C$ 183 | |||
| Inventory adjustments (C$)(iii) | 6,764 | 7 | (19,533) | (21) | 14,234 | 3 | (15,934) | (4) | |||
| Minesite costs (C$) | C$ 161,059 | C$ 161 | C$ 173,364 | C$ 185 | C$ 646,895 | C$ 156 | C$ 686,945 | C$ 179 | |||
| Fosterville(per ounce) | Three Months EndedDecember 31, | Year EndedDecember 31, | |||||||||
| 2024 | 2023 | 2024 | 2023 | ||||||||
| Gold production (ounces) | 37,139 | 49,533 | 225,203 | 277,694 | |||||||
| (thousands) | ($ per ounce) | (thousands) | ($ per ounce) | (thousands) | ($ per ounce) | (thousands) | ($ per ounce) | ||||
| Production costs | $ 32,221 | $ 868 | $ 31,329 | $ 632 | $ 147,045 | $ 653 | $ 131,298 | $ 473 | |||
| Inventory adjustments(ii) | 266 | 7 | 3,137 | 64 | (1,011) | (4) | 1,345 | 5 | |||
| Realized gains and losses on hedges of production costs | 216 | 6 | 1,319 | 27 | 222 | 1 | 3,097 | 11 | |||
| Other adjustments(v) | 18 | — | 6 | — | 70 | — | 52 | — | |||
| Total cash costs(co-product basis) | $ 32,721 | $ 881 | $ 35,791 | $ 723 | $ 146,326 | $ 650 | $ 135,792 | $ 489 | |||
| By-product metal revenues | (103) | (3) | — | — | (565) | (3) | (397) | (1) | |||
| Total cash costs(by-product basis) | $ 32,618 | $ 878 | $ 35,791 | $ 723 | $ 145,761 | $ 647 | $ 135,395 | $ 488 | |||
| Fosterville(per tonne) | Three Months EndedDecember 31, | Year EndedDecember 31, | |||||||||
| 2024 | 2023 | 2024 | 2023 | ||||||||
| Tonnes of ore milled (thousands) | 158 | 183 | 809 | 651 | |||||||
| (thousands) | ($ per tonne) | (thousands) | ($ per tonne) | (thousands) | ($ per tonne) | (thousands) | ($ per tonne) | ||||
| Production costs | $ 32,221 | $ 204 | $ 31,329 | $ 171 | $ 147,045 | $ 182 | $ 131,298 | $ 202 | |||
| Production costs (A$) | A$ 50,159 | A$ 319 | A$ 47,265 | A$ 259 | A$ 224,121 | A$ 277 | A$ 197,921 | A$ 304 | |||
| Inventory adjustments (A$)(ii) | 788 | 6 | 384 | 2 | (1,253) | (1) | (2,155) | (3) | |||
| Minesite costs (A$) | A$ 50,947 | A$ 325 | A$ 47,649 | A$ 261 | A$ 222,868 | A$ 276 | A$ 195,766 | A$ 301 | |||
| Kittila(per ounce) | Three Months EndedDecember 31, | Year EndedDecember 31, | |||||||||
| 2024 | 2023 | 2024 | 2023 | ||||||||
| Gold production (ounces) | 51,893 | 61,172 | 218,860 | 234,402 | |||||||
| (thousands) | ($ per ounce) | (thousands) | ($ per ounce) | (thousands) | ($ per ounce) | (thousands) | ($ per ounce) | ||||
| Production costs | $ 50,799 | $ 979 | $ 50,657 | $ 828 | $ 227,334 | $ 1,039 | $ 205,857 | $ 878 | |||
| Inventory adjustments(ii) | 2,382 | 46 | 2,653 | 43 | (1,172) | (6) | 2,958 | 13 | |||
| Realized gains and losses on hedges of production costs | 289 | 5 | (653) | (11) | 151 | 1 | (2,999) | (13) | |||
| Other adjustments(v) | (51) | (1) | (45) | — | (212) | (1) | (1,338) | (6) | |||
| Total cash costs(co-product basis) | $ 53,419 | $ 1,029 | $ 52,612 | $ 860 | $ 226,101 | $ 1,033 | $ 204,478 | $ 872 | |||
| By-product metal revenues | (194) | (3) | (145) | (2) | (483) | (2) | (358) | (1) | |||
| Total cash costs(by-product basis) | $ 53,225 | $ 1,026 | $ 52,467 | $ 858 | $ 225,618 | $ 1,031 | $ 204,120 | $ 871 | |||
| Kittila(per tonne) | Three Months EndedDecember 31, | Year EndedDecember 31, | |||||||||
| 2024 | 2023 | 2024 | 2023 | ||||||||
| Tonnes of ore milled (thousands) | 476 | 514 | 2,026 | 1,954 | |||||||
| (thousands) | ($ per tonne) | (thousands) | ($ per tonne) | (thousands) | ($ per tonne) | (thousands) | ($ per tonne) | ||||
| Production costs | $ 50,799 | $ 107 | $ 50,657 | $ 99 | $ 227,334 | $ 112 | $ 205,857 | $ 105 | |||
| Production costs (€) | € 47,910 | € 100 | € 46,950 | € 91 | € 210,285 | € 103 | € 191,023 | € 98 | |||
| Inventory adjustments (€)(iii) | 2,721 | 6 | 2,240 | 5 | (633) | — | 2,112 | 1 | |||
| Minesite costs (€) | € 50,631 | € 106 | € 49,190 | € 96 | € 209,652 | € 103 | € 193,135 | € 99 | |||
| Pinos Altos(per ounce) | Three Months EndedDecember 31, | Year EndedDecember 31, | |||||||||
| 2024 | 2023 | 2024 | 2023 | ||||||||
| Gold production (ounces) | 18,583 | 25,963 | 88,433 | 97,642 | |||||||
| (thousands) | ($ per ounce) | (thousands) | ($ per ounce) | (thousands) | ($ per ounce) | (thousands) | ($ per ounce) | ||||
| Production costs | $ 45,251 | $ 2,435 | $ 38,158 | $ 1,470 | $ 168,231 | $ 1,902 | $ 145,936 | $ 1,495 | |||
| Inventory adjustments(ii) | (1,557) | (84) | 1,241 | 48 | 678 | 8 | 2,979 | 31 | |||
| Realized gains and losses on hedges of production costs | 68 | 4 | (754) | (29) | 68 | 1 | (2,819) | (29) | |||
| Other adjustments(v) | 307 | 16 | 346 | 13 | 1,287 | 14 | 1,248 | 12 | |||
| Total cash costs(co-product basis) | $ 44,069 | $ 2,371 | $ 38,991 | $ 1,502 | $ 170,264 | $ 1,925 | $ 147,344 | $ 1,509 | |||
| By-product metal revenues | (8,368) | (450) | (7,585) | (292) | (34,924) | (395) | (27,339) | (280) | |||
| Total cash costs(by-product basis) | $ 35,701 | $ 1,921 | $ 31,406 | $ 1,210 | $ 135,340 | $ 1,530 | $ 120,005 | $ 1,229 | |||
| Pinos Altos(per tonne) | Three Months EndedDecember 31, | Year EndedDecember 31, | |||||||||
| 2024 | 2023 | 2024 | 2023 | ||||||||
| Tonnes of ore milled (thousands) | 381 | 441 | 1,707 | 1,656 | |||||||
| (thousands) | ($ per tonne) | (thousands) | ($ per tonne) | (thousands) | ($ per tonne) | (thousands) | ($ per tonne) | ||||
| Production costs | $ 45,251 | $ 119 | $ 38,158 | $ 87 | $ 168,231 | $ 99 | $ 145,936 | $ 88 | |||
| Inventory adjustments(iii) | (1,489) | (4) | 487 | 1 | 746 | — | 160 | — | |||
| Minesite costs | $ 43,762 | $ 115 | $ 38,645 | $ 88 | $ 168,977 | $ 99 | $ 146,096 | $ 88 | |||
| La India(per ounce) | Three Months EndedDecember 31, | Year EndedDecember 31, | |||||||||
| 2024 | 2023 | 2024 | 2023 | ||||||||
| Gold production (ounces) | 3,390 | 19,481 | 24,580 | 75,904 | |||||||
| (thousands) | ($ per ounce) | (thousands) | ($ per ounce) | (thousands) | ($ per ounce) | (thousands) | ($ per ounce) | ||||
| Production costs | $ 10,322 | $ 3,045 | $ 24,434 | $ 1,254 | $ 49,767 | $ 2,025 | $ 96,490 | $ 1,271 | |||
| Inventory adjustments(ii) | (4,102) | (1,210) | (1,782) | (91) | (1,322) | (54) | (1,335) | (18) | |||
| Other adjustments(v) | 46 | 13 | 182 | 9 | 401 | 16 | 584 | 8 | |||
| Total cash costs(co-product basis) | $ 6,266 | $ 1,848 | $ 22,834 | $ 1,172 | $ 48,846 | $ 1,987 | $ 95,739 | $ 1,261 | |||
| By-product metal revenues | (47) | (13) | (449) | (23) | (1,038) | (42) | (1,566) | (20) | |||
| Total cash costs(by-product basis) | $ 6,219 | $ 1,835 | $ 22,385 | $ 1,149 | $ 47,808 | $ 1,945 | $ 94,173 | $ 1,241 | |||
| La India(per tonne)(vi) | Three Months EndedDecember 31, | Year EndedDecember 31, | |||||||||
| 2024 | 2023 | 2024 | 2023 | ||||||||
| Tonnes of ore milled (thousands) | — | 500 | — | 3,010 | |||||||
| (thousands) | ($ per tonne) | (thousands) | ($ per tonne) | (thousands) | ($ per tonne) | (thousands) | ($ per tonne) | ||||
| Production costs | $ 10,322 | $ — | $ 24,434 | $ 49 | $ 49,767 | $ — | $ 96,490 | $ 32 | |||
| Inventory adjustments(iii) | (10,322) | — | (1,782) | (4) | (49,767) | — | (1,335) | — | |||
| Minesite costs | $ — | $ — | $ 22,652 | $ 45 | $ — | $ — | $ 95,155 | $ 32 | |||
| Notes: | |||||||||||
| (i) The information set out in this table reflects the Company’s 50% interest in Canadian Malartic up to and including March 30, 2023 and 100% interest thereafter following the closing of the Yamana Transaction. | |||||||||||
| (ii) Under the Company’s revenue recognition policy, revenue from contracts with customers is recognized upon the transfer of control over metals sold to the customer. As the total cash costs per ounce are calculated on a production basis, an inventory adjustment is made to reflect the portion of production not yet recognized as revenue. | |||||||||||
| (iii) This inventory adjustment reflects production costs associated with the portion of production still in inventory. | |||||||||||
| (iv) On March 31, 2023, the Company closed the Yamana Transaction and this adjustment reflects the fair value allocated to inventory at Canadian Malartic acquired as part of the purchase price allocation. | |||||||||||
| (v) Other adjustments consists of costs associated with a 5% in-kind royalty paid in respect of Canadian Malartic, a 2% in-kind royalty paid in respect of Detour Lake, a 1.5% in-kind royalty paid in respect of Macassa and smelting, refining, and marketing charges to production costs. | |||||||||||
| (vi) La India’s cost calculations per tonne for the three months and the year ended December 31, 2024 excludes approximately $10.3 and $49.8 million of production costs incurred during the period, respectively, following the cessation of mining activities at La India during the fourth quarter of 2023. |
All-in sustaining costs per ounce
All-in sustaining costs per ounce (also referred to as “AISC per ounce”) on a by-product basis is calculated as the aggregate of total cash costs on a by-product basis, sustaining capital expenditures (including capitalized exploration), general and administrative expenses (including stock options), lease payments related to sustaining assets and reclamation expenses, and then dividing by the number of ounces of gold produced. These additional costs reflect the additional expenditures that are required to be made to maintain current production levels. The AISC per ounce on a co-product basis is calculated in the same manner as the AISC per ounce on a by-product basis, except that the total cash costs on a co-product basis are used, meaning no adjustment is made for by-product metal revenues. Investors should note that AISC per ounce is not reflective of all cash expenditures as it does not include income tax payments, interest costs or dividend payments, nor does it include non-cash expenditures, such as depreciation and amortization. Unless otherwise indicated, all-in sustaining costs per ounce is reported on a by-product basis (see “Total cash costs per ounce” for a discussion of regarding the Company’s use of by-product basis reporting).
Management believes that AISC per ounce is useful to investors as it reflects total sustaining expenditures of producing and selling an ounce of gold while maintaining current operations and, as such, provides useful information about operating performance. Management is aware, and investors should note, that these per ounce measures of performance can be affected by fluctuations in foreign exchange rates and, in the case of AISC per ounce on a by-product basis, by-product metal prices. Management compensates for these inherent limitations by using, and investors should also consider using, these measures in conjunction with data prepared in accordance with IFRS and minesite costs per tonne as this measure is not necessarily indicative of operating costs or cash flow measures prepared in accordance with IFRS.
The Company follows the guidance on calculation of AISC per ounce released by the World Gold Council (“WGC”) in 2018. The WGC is a non-regulatory market development organization for the gold industry that has worked closely with its member companies to develop guidance in respect of relevant non-GAAP measures. Notwithstanding the Company’s adoption of the WGC’s guidance, AISC per ounce reported by the Company may not be comparable to data reported by other gold mining companies.
The following tables set out a reconciliation of production costs to all-in sustaining costs per ounce for the three and twelve months ended December 31, 2024 and December 31, 2023, on both a by-product basis (deducting by-product metals revenue from production costs) and co-product basis (without deducting by-product metal revenues).
| (United States dollars per ounce, except where noted) | Three Months EndedDecember 31, | Year Ended December 31, | |||||
| 2024 | 2023 | 2024 | 2023 | ||||
| Production costs per the consolidated statements of income(thousands of United States dollars) | $ 746,858 | $ 777,455 | $ 3,086,080 | $ 2,933,263 | |||
| Gold production (ounces) | 847,401 | 903,208 | 3,485,336 | 3,439,654 | |||
| Production costs per ounce | $ 881 | $ 861 | $ 885 | $ 853 | |||
| Adjustments: | |||||||
| Inventory adjustments(i) | 19 | 8 | 5 | 9 | |||
| Purchase price allocation to inventory(ii) | 7 | — | 2 | (8) | |||
| Realized gains and losses on hedges of production costs | 13 | 7 | 6 | 3 | |||
| Other(iii) | 46 | 40 | 42 | 36 | |||
| Total cash costs per ounce (co-product basis) | $ 966 | $ 916 | $ 940 | $ 893 | |||
| By-product metal revenues | (43) | (28) | (37) | (28) | |||
| Total cash costs per ounce (by-product basis) | $ 923 | $ 888 | $ 903 | $ 865 | |||
| Adjustments: | |||||||
| Sustaining capital expenditures (including capitalized exploration) | 302 | 239 | 258 | 235 | |||
| General and administrative expenses (including stock option expense) | 73 | 82 | 60 | 61 | |||
| Non-cash reclamation provision and sustaining leases(iv) | 18 | 18 | 18 | 18 | |||
| All-in sustaining costs per ounce (by-product basis) | $ 1,316 | $ 1,227 | $ 1,239 | $ 1,179 | |||
| By-product metal revenues | 43 | 28 | 37 | 28 | |||
| All-in sustaining costs per ounce (co-product basis) | $ 1,359 | $ 1,255 | $ 1,276 | $ 1,207 |
| Notes: | |||||||
| (i) Under the Company’s revenue recognition policy, revenue from contracts with customers is recognized upon the transfer of control over metals sold to the customer. As the total cash costs per ounce are calculated on a production basis, an inventory adjustment is made to reflect the portion of production not yet recognized as revenue. | |||||||
| (ii) On March 31, 2023, the Company closed the Yamana Transaction and this adjustment reflects the fair value allocated to inventory at Canadian Malartic acquired as part of the purchase price allocation. | |||||||
| (iii) Other adjustments consist of in-kind royalties, smelting, refining and marketing charges to production costs. | |||||||
| (iv) Sustaining leases are lease payments related to sustaining assets. |
Adjusted net income and adjusted net income per share
Adjusted net income and adjusted net income per share are calculated by adjusting the net income as recorded in the consolidated statements of income for the effects of certain items that the Company believes are not reflective of the Company’s underlying performance for the reporting period. Adjusted net income is calculated by adjusting net income for items such as foreign currency translation gains or losses, realized and unrealized gains or losses on derivative financial instruments, severance and transaction costs related to acquisitions, revaluation gains, environmental remediation, gains or losses on the disposal of assets, purchase price allocations to inventory, impairment loss charges and reversals and retroactive payments and income and mining taxes adjustments. Adjusted net income per share is calculated by dividing adjusted net income by the weighted average number of shares outstanding at the end of the period on a basic and diluted basis.
The Company believes that these generally accepted industry measures are useful to investors in that they allow for the evaluation of the results of continuing operations and in making comparisons between periods. Adjusted net income and adjusted net income per share are intended to provide investors with information about the Company’s continuing income generating capabilities from its core mining business, excluding the above adjustments, which the Company believes are not reflective of operational performance. Management uses this measure to, and believes it is useful to investors so they can, understand and monitor for the operating performance of the Company in conjunction with other data prepared in accordance with IFRS.
The following tables set out a reconciliation of net income (loss) per the consolidated statements of income (loss) to adjusted net income for the three and twelve months ended December 31, 2024, and December 31, 2023.
| Three Months Ended December 31, | Year Ended December 31, | ||||||
| (thousands of United States dollars) | 2024 | 2023 | 2024 | 2023 | |||
| Restated(i) | |||||||
| Net income (loss) for the period – basic | $ 509,255 | $ (374,057) | $ 1,895,581 | $ 1,941,307 | |||
| Dilutive impact of cash settling LTIP | — | — | — | (4,736) | |||
| Net income (loss) for the period – diluted | $ 509,255 | $ (373,962) | $ 1,895,581 | $ 1,936,571 | |||
| Foreign currency translation loss (gain) | 10,131 | 1,930 | 9,383 | (328) | |||
| Realized and unrealized loss (gain) on derivative financial instruments | 107,429 | (69,470) | 155,819 | (68,432) | |||
| Impairment loss | — | 787,000 | — | 787,000 | |||
| Transaction costs related to acquisitions | — | — | — | 21,503 | |||
| Revaluation gain on Yamana Transaction | — | — | — | (1,543,414) | |||
| Environmental remediation | 3,518 | 2,799 | 14,719 | 2,712 | |||
| Net loss on disposal of property, plant and equipment | 11,883 | 17,667 | 37,669 | 26,759 | |||
| Purchase price allocation to inventory(ii) | (5,771) | — | (5,771) | 26,477 | |||
| Other(iii) | 6,340 | — | 19,555 | 3,262 | |||
| Income and mining taxes adjustments(iv) | (10,329) | (76,617) | (9,183) | (100,910) | |||
| Adjusted net income for the period – basic | $ 632,456 | $ 289,252 | $ 2,117,772 | $ 1,095,936 | |||
| Adjusted net income for the period – diluted | $ 632,456 | $ 289,347 | $ 2,117,772 | $ 1,091,200 |
| Notes: | |||||||
| (i) Certain previously reported line items have been restated to reflect the final purchase price allocation of the Yamana Transaction. | |||||||
| (ii) As part of the purchase price allocation in a business combination, the Company is required to determine the fair value of net assets acquired. These non-cash fair value adjustments which impacted the cost of inventory sold during the period and are not representative of ongoing operations, were removed from net income (loss) in the calculation of adjusted net income. | |||||||
| (iii) Other adjustments relate to retroactive payments that management considers not reflective of the Company’s underlying performance in the current period. | |||||||
| (iv) Income and mining taxes adjustments reflect items such as foreign currency translation recorded to the income and mining taxes expense, the impact of income and mining taxes on adjusted items, recognition of previously unrecognized capital losses, the result of income and mining taxes audits, impact of tax law changes and adjustments to prior period tax filings. |
EBITDA and adjusted EBITDA
EBITDA is calculated by adjusting net income (loss) for finance costs, amortization of property, plant and mine development and income and mining tax expense line items as reported in the consolidated statements of income.
Adjusted EBITDA removes the effects of certain items that the Company believes are not reflective of the Company’s underlying performance for the reporting period. Adjusted EBITDA is calculated by adjusting the EBITDA for items such as foreign currency translation gains or losses, realized and unrealized gains or losses on derivative financial instruments, severance and transaction costs related to acquisitions, revaluation gains, environmental remediation, gains or losses on the disposal of assets, purchase price allocations to inventory, impairment loss charges and reversals and retroactive payments.
The Company believes that these generally accepted industry measures are useful in that they allow for the evaluation of the cash generating capability of the Company to fund its working capital, capital expenditure and debt repayments. EBITDA and Adjusted EBITDA are intended to provide investors with information about the Company’s continuing cash generating capability from its core mining business, excluding the above adjustments, which management believes are not reflective of operational performance. Management uses these measures to, and believes it is useful to investors so they can, understand and monitor the cash generating capability of the Company in conjunction with other data prepared in accordance with IFRS.
The following tables set out a reconciliation of net income (loss) per the consolidated statements of income (loss) to EBITDA and adjusted EBITDA for the three and twelve months ended December 31, 2024, and December 31, 2023.
| Three Months Ended December 31, | Year Ended December 31, | ||||||
| (thousands of United States dollars) | 2024 | 2023 | 2024 | 2023 | |||
| Restated(i) | |||||||
| Net income (loss) for the period | $ 509,255 | $ (374,057) | $ 1,895,581 | $ 1,941,307 | |||
| Finance costs | 27,473 | 35,098 | 126,738 | 130,087 | |||
| Amortization of property, plant and mine development | 388,217 | 380,407 | 1,514,076 | 1,491,771 | |||
| Income and mining tax expense | 273,256 | 61,124 | 925,974 | 417,762 | |||
| EBITDA | 1,198,201 | 102,572 | 4,462,369 | 3,980,927 | |||
| Foreign currency translation loss (gain) | 10,131 | 1,930 | 9,383 | (328) | |||
| Realized and unrealized loss (gain) on derivative financial instruments | 107,429 | (69,470) | 155,819 | (68,432) | |||
| Impairment loss | — | 787,000 | — | 787,000 | |||
| Transaction costs related to acquisitions | — | — | — | 21,503 | |||
| Revaluation gain on Yamana Transaction | — | — | — | (1,543,414) | |||
| Environmental remediation | 3,518 | 2,799 | 14,719 | 2,712 | |||
| Net loss on disposal of property, plant and equipment | 11,883 | 17,667 | 37,669 | 26,759 | |||
| Purchase price allocation to inventory(ii) | (5,771) | — | (5,771) | 26,477 | |||
| Other(iii) | 6,340 | — | 19,555 | 3,262 | |||
| Adjusted EBITDA | $ 1,331,731 | $ 842,498 | $ 4,693,743 | $ 3,236,466 |
| Notes: | |||||||
| (i) Certain previously reported line items have been restated to reflect the final purchase price allocation of the Yamana Transaction. | |||||||
| (ii) As part of the purchase price allocation in a business combination, the Company is required to determine the fair value of net assets acquired. These non-cash fair value adjustments which impacted the cost of inventory sold during the period and are not representative of ongoing operations, were removed from net income (loss) in the calculation of adjusted EBITDA. | |||||||
| (iii) Other adjustments relate to retroactive payments that management considers not reflective of the Company’s underlying performance in the current period. |
Cash provided by operating activities before changes in non-cash working capital balances and cash provided by operating activities before changes in non-cash working capital balances per share
Cash provided by operating activities before changes in non-cash working capital balances and cash provided by operating activities before changes in non-cash working capital balances per share are calculated by adjusting the cash provided by operating activities as shown in the consolidated statements of cash flows for the effects of changes in non-cash working capital balances such as income taxes, inventories, other current assets, accounts payable and accrued liabilities and interest payable. The per share amount is calculated by dividing cash provided by operating activities before changes in non-cash working capital balances by the weighted average number of shares outstanding at the end of the period on a basic basis. The Company believes that changes in working capital can be volatile due to numerous factors, including the timing of payments. Management uses these measures to, and believes they are useful to investors so they can, assess the underlying operating cash flow performance and future operating cash flow generating capabilities of the Company in conjunction with other data prepared in accordance with IFRS. A reconciliation of these measures to the nearest IFRS measure is provided below.
Free cash flow and free cash flow before changes in non-cash working capital balances
Free cash flow is calculated by deducting additions to property, plant and mine development from the cash provided by operating activities line item as recorded in the consolidated statements of cash flows.
Free cash flow before changes in non-cash components of working capital is calculated by excluding items such as the effect of changes in non-cash components of working capital from free cash flow, which includes income taxes, inventory, other current assets, accounts payable and accrued liabilities and interest payable.
The Company believes that these generally accepted industry measures are useful in that they allow for the evaluation of the Company’s ability to repay creditors and return cash to shareholders without relying on external sources of funding. Free cash flow and free cash flow before changes in non-cash components of working capital also provide investors with information about the Company’s financial position and its ability to generate cash to fund operational and capital requirements as well as return cash to shareholders. Management uses these measures in conjunction with other data prepared in accordance with IFRS to, and believes it is useful to investors so they can, understand and monitor the cash generating ability of the Company.
The following tables set out a reconciliation of cash provided by operating activities per the consolidated statements of cash flows to free cash flow and free cash flow before changes in non-cash working capital balances and to cash provided by operating activities before changes in non-cash working capital balances for the three and twelve months ended December 31, 2024, and December 31, 2023.
| Three Months Ended December 31, | Year Ended December 31, | ||||||
| (thousands of United States dollars) | 2024 | 2023 | 2024 | 2023 | |||
| Cash provided by operating activities | $ 1,131,849 | $ 727,861 | $ 3,960,892 | $ 2,601,562 | |||
| Additions to property, plant and mine development | (562,163) | (425,742) | (1,817,949) | (1,654,129) | |||
| Free Cash Flow | 569,686 | 302,119 | 2,142,943 | 947,433 | |||
| Changes in income taxes | (116,595) | (21,870) | (259,327) | (103,850) | |||
| Changes in inventory | 42,573 | 24,170 | 208,300 | 169,168 | |||
| Changes in other current assets | (17,403) | (6,016) | (1,166) | 80,931 | |||
| Changes in accounts payable and accrued liabilities | 37,896 | 48,649 | (36,726) | (2,778) | |||
| Changes in interest payable | 11,762 | 4,685 | 8,895 | 2,925 | |||
| Free cash flow before changes in non-cash working capital balances | $ 527,919 | $ 351,737 | $ 2,062,919 | $ 1,093,829 | |||
| Additions to property, plant and mine development | 562,163 | 425,742 | 1,817,949 | 1,654,129 | |||
| Cash provided by operating activities before changes in non-cash working capital balances | $ 1,090,082 | $ 777,479 | $ 3,880,868 | $ 2,747,958 | |||
| Cash provided by operating activities per share – basic | $ 2.26 | $ 1.47 | $ 7.92 | $ 5.32 | |||
| Cash provided by operating activities before changes in non-cash working capital balances per share – basic | $ 2.17 | $ 1.57 | $ 7.76 | $ 5.62 | |||
| Free cash flow per share – basic | $ 1.14 | $ 0.61 | $ 4.29 | $ 1.94 | |||
| Free cash flow before changes in non-cash working capital balances – basic | $ 1.05 | $ 0.71 | $ 4.13 | $ 2.24 |
Operating margin
Operating margin is calculated by deducting production costs from revenue from mining operations. In order to reconcile operating margin to net income (loss) as recorded in the consolidated financial statements, the Company adds the following items to the operating margin: income and mining taxes expense; other expenses (income); care and maintenance expenses; foreign currency translation (gain) loss; environmental remediation costs; gain (loss) on derivative financial instruments; finance costs; general and administrative expenses; amortization of property, plant and mine development; exploration and corporate development expenses; and revaluation gain and impairment losses (reversals). The Company believes that operating margin is a useful measure to investors as it reflects the operating performance of its individual mines associated with the ongoing production and sale of gold and by-product metals without allocating Company-wide overhead, including exploration and corporate development expenses, amortization of property, plant and mine development, general and administrative expenses, finance costs, gain and losses on derivative financial instruments, environmental remediation costs, foreign currency translation gains and losses, other expenses and income and mining tax expenses. Management uses this measure internally to plan and forecast future operating results. Management believes this measure is useful to investors as it provides them with additional information about the Company’s underlying operating results and should be evaluated in conjunction with other data prepared in accordance with IFRS. For a reconciliation of operating margin to revenue from mining operations reported in the Company’s financial statements, see “Summary of Operations Key Performance Indicators” below.
Capital expenditures
Capital expenditures are calculated by deducting working capital adjustments from additions to property, plant and mine development per the consolidated statements of cash flows.
Capital expenditures are classified into sustaining capital expenditures, sustaining capitalized exploration, development capital expenditures and development capitalized exploration. Sustaining capital expenditures and sustaining capitalized exploration are expenditures incurred during the production phase to sustain and maintain existing assets so they can achieve constant expected levels of production from which the Company will derive economic benefits. Sustaining capital expenditures and sustaining capitalized exploration include expenditure for assets to retain their existing productive capacity as well as to enhance performance and reliability of the operations. Development capital expenditures and development capitalized exploration represent the spending at new projects and/or expenditures at existing operations that are undertaken with the intention to increase production levels or mine life above the current plans. Management uses these measures in the capital allocation process and to assess the effectiveness of its investments. Management believes these measures are useful so investors can assess the purpose and effectiveness of the capital expenditures split between sustaining and development in each reporting period. The classification between sustaining and development capital expenditures does not have a standardized definition in accordance with IFRS and other companies may classify expenditures in a different manner.
The following tables set out a reconciliation of sustaining capital expenditures, sustaining capitalized exploration, development capital expenditures and development capitalized exploration to the additions to property, plant and mine development per the consolidated statements of cash flows for the three and twelve months ended December 31, 2024 and December 31, 2023.
| (thousands of United States dollars) | Three Months Ended December 31, | Year Ended December 31, | |||||
| 2024 | 2023(i) | 2024 | 2023(i) | ||||
| Sustaining capital expenditures | $ 256,266 | $ 210,678 | $ 890,051 | $ 793,818 | |||
| Sustaining capitalized exploration | 3,578 | 4,079 | 18,702 | 13,789 | |||
| Development capital expenditures | 264,442 | 194,968 | 767,366 | 681,257 | |||
| Development capitalized exploration | 51,559 | 26,936 | 164,841 | 112,004 | |||
| Total Capital Expenditures | $ 575,845 | $ 436,661 | $ 1,840,960 | $ 1,600,868 | |||
| Working capital adjustments | (13,682) | (10,919) | (23,011) | 53,261 | |||
| Additions to property, plant and mine development per the consolidated statements of cash flows | $ 562,163 | $ 425,742 | $ 1,817,949 | $ 1,654,129 |
| Note: | |||||||
| (i) The information set out in this table reflects the Company’s 50% interest in Canadian Malartic up to and including March 30, 2023 and 100% interest thereafter following the closing of the Yamana Transaction. |
Net debt
Net debt is calculated by adjusting the total of the current portion of long-term debt and non-current long-term debt as recorded on the consolidated balance sheets for deferred financing costs and cash and cash equivalents. Management believes the measure of net debt is useful to help investors to determine the Company’s overall debt position and to evaluate the future debt capacity of the Company.
The following tables set out a reconciliation of long-term debt per the consolidated balance sheets to net debt as at December 31, 2024, and December 31, 2023.
| As at | As at | ||
| (thousands of United States dollars) | December 31, 2024 | December 31, 2023 | |
| Current portion of long-term debt per the consolidated balance sheets | $ 90,000 | $ 100,000 | |
| Non-current portion of long-term debt | 1,052,956 | 1,743,086 | |
| Long-term debt | $ 1,142,956 | $ 1,843,086 | |
| Adjustment: | |||
| Cash and cash equivalents | $ (926,431) | $ (338,648) | |
| Net Debt | $ 216,525 | $ 1,504,438 |
Forward-Looking Non-GAAP Measures
This news release also contains information as to estimated future total cash costs per ounce, AISC per ounce and minesite costs per tonne. The estimates are based upon the total cash costs per ounce, AISC per ounce and minesite costs per tonne that the Company expects to incur to mine gold at its mines and projects and, consistent with the reconciliation of these actual costs referred to above, do not include production costs attributable to accretion expense and other asset retirement costs, which will vary over time as each project is developed and mined. It is therefore not practicable to reconcile these forward-looking non-GAAP financial measures to the most comparable IFRS measure.
Forward-Looking Statements
The information in this news release has been prepared as at February 13, 2025. Certain statements contained in this news release constitute “forward-looking statements” within the meaning of the United States Private Securities Litigation Reform Act of 1995 and “forward-looking information” under the provisions of Canadian provincial securities laws and are referred to herein as “forward-looking statements”. All statements, other than statements of historical fact, that address circumstances, events, activities or developments that could, or may or will occur are forward-looking statements. When used in this news release, the words “achieve”, “aim”, “anticipate”, “commit”, “could”, “estimate”, “expect”, “forecast”, “future”, “guide”, “plan”, “potential”, “schedule”, “target”, “track”, “will”, and similar expressions are intended to identify forward-looking statements. Such statements include the Company’s forward-looking guidance, including metal production, estimated ore grades, recovery rates, project timelines, drilling targets or results, life of mine estimates, total cash costs per ounce, AISC per ounce, minesite costs per tonne, other expenses and cash flows; the potential for additional gold production at the Company’s sites; the estimated timing and conclusions of the Company’s studies and evaluations; the methods by which ore will be extracted or processed; the Company’s expansion plans at Detour Lake, Upper Beaver and Odyssey, including the timing, funding, completion and commissioning thereof and the commencement of production therefrom; the Company’s plans at Hope Bay and San Nicolás; statements concerning the potential to increase production at Fosterville to an average of approximately 175,000 ounces of gold per year; statements concerning the Company’s “fill-the-mill” strategy at Canadian Malartic, including the potential for a second shaft at Odyssey and plans at the Wasamac and Marban projects; statements concerning other expansion projects, recovery rates, mill throughput, optimization efforts and projected exploration, including costs and other estimates upon which such projections are based; timing and amounts of capital expenditures, other expenditures and other cash needs, and expectations as to the funding thereof; estimates of future mineral reserves, mineral resources, mineral production and sales; the projected development of certain ore deposits, including estimates of exploration, development and production and other capital costs and estimates of the timing of such exploration, development and production or decisions with respect to such exploration, development and production; anticipated cost inflation and its effect on the Company’s costs and results; estimates of mineral reserves and mineral resources and the effect of drill results and studies on future mineral reserves and mineral resources; the Company’s ability to obtain the necessary permits and authorizations in connection with its proposed or current exploration, development and mining operations, including at Meliadine, Upper Beaver and San Nicolás, and the anticipated timing thereof; future exploration; the anticipated timing of events with respect to the Company’s mine sites; the Company’s plans and strategies with respect to climate change and greenhouse gas emissions reductions; the sufficiency of the Company’s cash resources; the Company’s plans with respect to hedging and the effectiveness of its hedging strategies; future activity with respect to the Company’s unsecured revolving bank credit facility and other indebtedness; future dividend amounts, record dates and payment dates; plans with respect to activity under the NCIB; and anticipated trends with respect to the Company’s operations, exploration and the funding thereof. Such statements reflect the Company’s views as at the date of this news release and are subject to certain risks, uncertainties and assumptions, and undue reliance should not be placed on such statements. Forward-looking statements are necessarily based upon a number of factors and assumptions that, while considered reasonable by Agnico Eagle as of the date of such statements, are inherently subject to significant business, economic and competitive uncertainties and contingencies. The material factors and assumptions used in the preparation of the forward-looking statements contained herein, which may prove to be incorrect, include, but are not limited to, the assumptions set forth herein and in management’s discussion and analysis (“MD&A”) and the Company’s Annual Information Form (“AIF”) for the year ended December 31, 2023 filed with Canadian securities regulators and that are included in its Annual Report on Form 40-F for the year ended December 31, 2023 (“Form 40-F”) filed with the U.S. Securities and Exchange Commission (the “SEC”) as well as: that there are no significant disruptions affecting operations; that production, permitting, development, expansion and the ramp-up of operations at each of Agnico Eagle’s properties proceeds on a basis consistent with current expectations and plans; that the Company’s plans for its mining operations are not changed or amended in a material way; that the relevant metal prices, foreign exchange rates and prices for key mining and construction inputs (including labour and electricity) will be consistent with Agnico Eagle’s expectations; that the effect of tariffs will not materially affect the price or availability of the inputs the Company uses at its operations; that Agnico Eagle’s current estimates of mineral reserves, mineral resources, mineral grades and metal recovery are accurate; that there are no material delays in the timing for completion of ongoing growth projects; that seismic activity at the Company’s operations at LaRonde, Goldex, Fosterville and other properties is as expected by the Company and that the Company’s efforts to mitigate its effect on mining operations, including with respect to community relations, are successful; that the Company’s current plans to address climate change and reduce greenhouse gas emissions are successful; that the Company’s current plans to optimize production are successful; that there are no material variations in the current tax and regulatory environment; that governments, the Company or others do not take measures in response to pandemics or other health emergencies or otherwise that, individually or in the aggregate, materially affect the Company’s ability to operate its business or its productivity; and that measures taken relating to, or other effects of, pandemics or other health emergencies do not affect the Company’s ability to obtain necessary supplies and deliver them to its mine sites. Many factors, known and unknown, could cause the actual results to be materially different from those expressed or implied by such forward-looking statements. Such risks include, but are not limited to: the volatility of prices of gold and other metals; uncertainty of mineral reserves, mineral resources, mineral grades and mineral recovery estimates; uncertainty of future production, project development, capital expenditures and other costs; foreign exchange rate fluctuations; inflationary pressures; financing of additional capital requirements; cost of exploration and development programs; seismic activity at the Company’s operations, including at LaRonde, Goldex and Fosterville; mining risks; community protests, including by Indigenous groups; risks associated with foreign operations; risks associated with joint ventures; governmental and environmental regulation; the volatility of the Company’s stock price; risks associated with the Company’s currency, fuel and by-product metal derivative strategies; the current interest rate environment; the potential for major economies to encounter a slowdown in economic activity or a recession; the potential for increased conflict or hostilities in various regions, including Europe and the Middle East; and the extent and manner of communicable diseases or outbreaks, and measures taken by governments, the Company or others to attempt to mitigate the spread thereof may directly or indirectly affect the Company. For a more detailed discussion of such risks and other factors that may affect the Company’s ability to achieve the expectations set forth in the forward-looking statements contained in this news release, see the AIF and MD&A filed on SEDAR+ at www.sedarplus.ca and included in the Form 40-F filed on EDGAR at www.sec.gov, as well as the Company’s other filings with the Canadian securities regulators and the SEC. Other than as required by law, the Company does not intend, and does not assume any obligation, to update these forward-looking statements.
Notes to Investors Regarding the Use of Mineral Resources
The mineral reserve and mineral resource estimates contained in this news release have been prepared in accordance with the Canadian securities administrators’ (the “CSA”) National Instrument 43-101 – Standards of Disclosure for Mineral Projects (“NI 43-101”).
The SEC’s disclosure requirements and policies for mining properties now more closely align with current industry and global regulatory practices and standards, including NI 43-101; however Canadian issuers that report in the United States using the Multijurisdictional Disclosure System (“MJDS”), such as the Company, may still use NI 43-101 rather than the SEC disclosure requirements when using the SEC’s MJDS registration statement and annual report forms. Accordingly, mineral reserve and mineral resource information contained in this news release may not be comparable to similar information disclosed by U.S. companies.
Investors are cautioned that while the SEC recognizes “measured mineral resources”, “indicated mineral resources” and “inferred mineral resources”, investors should not assume that any part or all of the mineral deposits in these categories will ever be converted into a higher category of mineral resources or into mineral reserves. These terms have a great amount of uncertainty as to their economic and legal feasibility. Accordingly, investors are cautioned not to assume that any “measured mineral resources”, “indicated mineral resources” or “inferred mineral resources” that the Company reports in this news release are or will be economically or legally mineable. Under Canadian regulations, estimates of inferred mineral resources may not form the basis of feasibility or pre-feasibility studies, except in limited circumstances.
Further, “inferred mineral resources” have a great amount of uncertainty as to their existence and as to their economic and legal feasibility. It cannot be assumed that any part or all of an inferred mineral resource will ever be upgraded to a higher category.
The mineral reserve and mineral resource data set out in this news release are estimates, and no assurance can be given that the anticipated tonnages and grades will be achieved or that the indicated level of recovery will be realized. The Company does not include equivalent gold ounces for by-product metals contained in mineral reserves in its calculation of contained ounces. Mineral reserves are not reported as a subset of mineral resources.
Scientific and Technical Information
The scientific and technical information contained in this news release relating to Nunavut, Quebec and Finland operations has been approved by Dominique Girard, Eng., Executive Vice-President & Chief Operating Officer – Nunavut, Quebec & Europe; relating to Ontario, Australia and Mexico operations has been approved by Natasha Vaz, P.Eng., Executive Vice-President & Chief Operating Officer – Ontario, Australia & Mexico; relating to exploration has been approved by Guy Gosselin, Eng. and P.Geo., Executive Vice-President, Exploration; and relating to mineral reserves and mineral resources has been approved by Dyane Duquette, P.Geo., Vice-President, Mineral Resources Management, each of whom is a “Qualified Person” for the purposes of NI 43-101.
Detailed Mineral Reserve and Mineral Resource Data
| Mineral Reserves as at December 31, 2024 | |||||||||||
| Operation / Project | Proven | Probable | Proven & Probable | ||||||||
| Gold | Mining Method* | 000Tonnes | g/t | 000 Oz Au | 000 Tonnes | g/t | 000 Oz Au | 000 Tonnes | g/t | 000 Oz Au | Recovery %** |
| LaRonde mine1 | U/G | 2,398 | 4.84 | 373 | 8,334 | 6.38 | 1,709 | 10,731 | 6.03 | 2,081 | 94.6 |
| LaRonde Zone 52 | U/G | 5,026 | 2.10 | 339 | 4,241 | 2.34 | 319 | 9,267 | 2.21 | 659 | 94.7 |
| LaRonde Total | 7,424 | 2.98 | 712 | 12,574 | 5.02 | 2,028 | 19,998 | 4.26 | 2,740 | ||
| Canadian Malartic mine3 | O/P | 40,383 | 0.52 | 677 | 34,533 | 1.14 | 1,267 | 74,916 | 0.81 | 1,944 | 89.3 |
| Odyssey deposit4 | U/G | 36 | 2.41 | 3 | 4,318 | 2.27 | 315 | 4,354 | 2.27 | 317 | 95.0 |
| East Gouldie5 | U/G | — | — | — | 48,278 | 3.37 | 5,236 | 48,278 | 3.37 | 5,236 | 94.4 |
| Canadian Malartic Total | 40,419 | 0.52 | 680 | 87,128 | 2.43 | 6,818 | 127,547 | 1.83 | 7,497 | ||
| Goldex6 | U/G | 5,472 | 1.43 | 251 | 10,137 | 1.65 | 538 | 15,609 | 1.57 | 789 | 86.9 |
| Akasaba West7 | O/P | 846 | 0.82 | 22 | 3,948 | 0.91 | 116 | 4,794 | 0.90 | 138 | 77.0 |
| Goldex Total | 6,318 | 1.34 | 273 | 14,085 | 1.44 | 654 | 20,403 | 1.41 | 927 | ||
| Wasamac | U/G | — | — | — | 14,757 | 2.90 | 1,377 | 14,757 | 2.90 | 1,377 | 89.7 |
| Quebec Total | 54,161 | 0.96 | 1,665 | 128,545 | 2.63 | 10,876 | 182,706 | 2.13 | 12,541 | ||
| Detour Lake(At or above 0.5 g/t) | O/P | 75,405 | 1.08 | 2,616 | 447,790 | 0.90 | 13,020 | 523,195 | 0.93 | 15,636 | 92.0 |
| Detour Lake(Below 0.5 g/t) | O/P | 53,049 | 0.42 | 717 | 218,861 | 0.38 | 2,698 | 271,910 | 0.39 | 3,415 | 92.0 |
| Detour Lake Total8 | 128,454 | 0.81 | 3,333 | 666,651 | 0.73 | 15,718 | 795,105 | 0.75 | 19,051 | ||
| Macassa9 | U/G | 325 | 13.24 | 138 | 5,096 | 10.32 | 1,691 | 5,421 | 10.50 | 1,829 | 97.1 |
| Macassa Near Surface10 | U/G | 4 | 7.76 | 1 | 65 | 5.15 | 11 | 69 | 5.31 | 12 | 95.0 |
| AK deposit11 | U/G | 23 | 5.11 | 4 | 1,514 | 4.71 | 229 | 1,537 | 4.71 | 233 | 93.7 |
| Macassa Total | 352 | 12.65 | 143 | 6,675 | 9.00 | 1,931 | 7,027 | 9.18 | 2,074 | ||
| Upper Beaver12 | O/P | — | — | — | 3,235 | 1.82 | 189 | 3,235 | 1.82 | 189 | 95.5 |
| Upper Beaver12 | U/G | — | — | — | 19,946 | 4.02 | 2,579 | 19,946 | 4.02 | 2,579 | 95.5 |
| Upper Beaver Total | — | — | — | 23,181 | 3.71 | 2,768 | 23,181 | 3.71 | 2,768 | ||
| Hammond Reef13 | O/P | — | — | — | 123,473 | 0.84 | 3,323 | 123,473 | 0.84 | 3,323 | 89.2 |
| Ontario Total | 128,806 | 0.84 | 3,476 | 819,979 | 0.90 | 23,740 | 948,785 | 0.89 | 27,216 | ||
| Amaruq | O/P | 3,310 | 1.81 | 193 | 8,657 | 3.33 | 928 | 11,967 | 2.91 | 1,121 | 90.7 |
| Amaruq | U/G | 45 | 4.86 | 7 | 2,858 | 5.23 | 481 | 2,903 | 5.23 | 488 | 90.7 |
| Meadowbank Total14 | 3,355 | 1.86 | 200 | 11,516 | 3.80 | 1,408 | 14,871 | 3.36 | 1,609 | ||
| Meliadine | O/P | 324 | 3.47 | 36 | 5,241 | 4.10 | 690 | 5,565 | 4.06 | 726 | 96.0 |
| Meliadine | U/G | 1,666 | 6.93 | 371 | 12,557 | 5.62 | 2,268 | 14,223 | 5.77 | 2,639 | 96.0 |
| Meliadine Total15 | 1,990 | 6.37 | 407 | 17,798 | 5.17 | 2,958 | 19,788 | 5.29 | 3,365 | ||
| Hope Bay16 | U/G | 93 | 6.77 | 20 | 16,120 | 6.52 | 3,378 | 16,212 | 6.52 | 3,398 | 87.5 |
| Nunavut Total | 5,438 | 3.59 | 628 | 45,433 | 5.30 | 7,744 | 50,871 | 5.12 | 8,372 | ||
| *Open Pit (“O/P”), Underground (“U/G”) | |||||||||||
| ** Represents metallurgical recovery percentage | |||||||||||
| Operation / Project | Proven | Probable | Proven & Probable | ||||||||
| Gold | Mining Method* | 000Tonnes | g/t | 000 Oz Au | 000 Tonnes | g/t | 000 Oz Au | 000 Tonnes | g/t | 000 Oz Au | Recovery %** |
| Fosterville17 | U/G | 888 | 5.77 | 165 | 8,666 | 5.33 | 1,486 | 9,553 | 5.37 | 1,650 | 92.0 |
| Australia Total | 888 | 5.77 | 165 | 8,666 | 5.33 | 1,486 | 9,553 | 5.37 | 1,650 | ||
| Kittila18 | U/G | 616 | 4.33 | 86 | 24,782 | 4.16 | 3,314 | 25,398 | 4.16 | 3,400 | 86.4 |
| Europe Total | 616 | 4.33 | 86 | 24,782 | 4.16 | 3,314 | 25,398 | 4.16 | 3,400 | ||
| Pinos Altos | O/P | — | — | — | 1,884 | 1.04 | 63 | 1,884 | 1.04 | 63 | 94.4 |
| Pinos Altos | U/G | 1,484 | 2.09 | 100 | 3,589 | 2.35 | 271 | 5,072 | 2.27 | 370 | 94.1 |
| Pinos Altos Total19 | 1,484 | 2.09 | 100 | 5,472 | 1.90 | 334 | 6,956 | 1.94 | 433 | ||
| San Nicolás (50%)20 | O/P | 23,858 | 0.41 | 314 | 28,761 | 0.39 | 358 | 52,619 | 0.40 | 672 | 17.6 |
| Mexico Total | 25,341 | 0.51 | 414 | 34,234 | 0.63 | 691 | 59,575 | 0.58 | 1,105 | ||
| Total Gold | 215,249 | 0.93 | 6,433 | 1,061,639 | 1.40 | 47,852 | 1,276,888 | 1.32 | 54,284 | ||
| Silver | Mining Method* | 000Tonnes | g/t | 000 Oz Ag | 000 Tonnes | g/t | 000 Oz Ag | 000 Tonnes | g/t | 000 Oz Ag | Recovery %** |
| LaRonde mine | U/G | 2,398 | 13.29 | 1,024 | 8,334 | 21.67 | 5,805 | 10,731 | 19.79 | 6,830 | 77.4 |
| Pinos Altos | O/P | — | — | — | 1,884 | 32.53 | 1,970 | 1,884 | 32.53 | 1,970 | 44.5 |
| Pinos Altos | U/G | 1,484 | 48.13 | 2,296 | 3,589 | 36.72 | 4,236 | 5,072 | 40.05 | 6,532 | 48.1 |
| Pinos Altos Total | 1,484 | 48.13 | 2,296 | 5,472 | 35.28 | 6,206 | 6,956 | 38.02 | 8,502 | ||
| San Nicolás (50%) | O/P | 23,858 | 23.93 | 18,356 | 28,761 | 20.91 | 19,333 | 52,619 | 22.28 | 37,689 | 38.6 |
| Total Silver | 27,739 | 24.31 | 21,677 | 42,567 | 22.90 | 31,344 | 70,307 | 23.46 | 53,021 | ||
| Copper | Mining Method* | 000Tonnes | % | Tonnes Cu | 000 Tonnes | % | Tonnes Cu | 000 Tonnes | % | Tonnes Cu | Recovery %** |
| LaRonde mine | U/G | 2,398 | 0.20 | 4,808 | 8,334 | 0.30 | 25,224 | 10,731 | 0.28 | 30,033 | 83.8 |
| Akasaba West | O/P | 846 | 0.49 | 4,144 | 3,948 | 0.50 | 19,851 | 4,794 | 0.50 | 23,995 | 77.4 |
| Upper Beaver | O/P | — | — | — | 3,235 | 0.14 | 4,477 | 3,235 | 0.14 | 4,477 | 79.2 |
| Upper Beaver | U/G | — | — | — | 19,946 | 0.25 | 50,453 | 19,946 | 0.25 | 50,453 | 79.2 |
| Upper Beaver Total | — | — | — | 23,181 | 0.24 | 54,930 | 23,181 | 0.24 | 54,930 | ||
| San Nicolás (50%) | O/P | 23,858 | 1.26 | 299,809 | 28,761 | 1.01 | 291,721 | 52,619 | 1.12 | 591,530 | 78.2 |
| Total Copper | 27,102 | 1.14 | 308,761 | 64,224 | 0.61 | 391,727 | 91,326 | 0.77 | 700,488 | ||
| Zinc | Mining Method* | 000Tonnes | % | Tonnes Zn | 000 Tonnes | % | Tonnes Zn | 000 Tonnes | % | Tonnes Zn | Recovery %** |
| LaRonde mine | U/G | 2,398 | 0.49 | 11,803 | 8,334 | 1.12 | 93,022 | 10,731 | 0.98 | 104,825 | 66.9 |
| San Nicolás (50%) | O/P | 23,858 | 1.61 | 383,313 | 28,761 | 1.37 | 394,115 | 52,619 | 1.48 | 777,428 | 80.9 |
| Total Zinc | 26,256 | 1.50 | 395,115 | 37,095 | 1.31 | 487,137 | 63,351 | 1.39 | 882,252 |
| 1 LaRonde mine: Net smelter value cut-off varies according to mining type and depth, not less than C$87/t for LP1 (Area 11-3) and not less than C$210/t for LaRonde. |
| 2 LaRonde Zone 5: Gold cut-off grade varies according to stope size and depth, not less than 1.44 g/t. |
| 3 Canadian Malartic: Gold cut-off grade is 0.35 g/t. |
| 4 Odyssey deposit: Gold cut-off grade varies according to mining zone and depth, not less than 1.51 g/t. |
| 5 East Gouldie: Gold cut-off grade not less than 1.62 g/t. |
| 6 Goldex: Gold cut-off grade varies according to mining type and depth, not less than 0.90 g/t. |
| 7 Akasaba West: Net smelter value cut-off varies, not less than C$31.96/t. |
| 8 Detour Lake: Gold cut-off grade is 0.30 g/t. |
| 9 Macassa: Gold cut-off grade varies according to mining type, not less than 3.85 g/t for long hole method and 4.24 g/t for cut and fill method. |
| 10 Macassa Near Surface deposit: Gold cut-off grade not less than 2.43 g/t. |
| 11 Amalgamated Kirkland (“AK”) deposit: Gold cut-off grade not less than 2.43 g/t. |
| 12 Upper Beaver: Net smelter value cut-off varies according to mining type, not less than C$118.17/t for underground and C$43.49/t for open pit. |
| 13 Hammond Reef: Gold cut-off grade is 0.41 g/t. |
| 14 Amaruq: Gold cut-off grade varies according to mining type, not less than 0.98 g/t for open pit mineral reserves and 3.05 g/t for underground mineral reserves (gold cut-off grade for marginal underground mineral reserves from development is 1.17 g/t). |
| 15 Meliadine: Gold cut-off grade varies according to mining type, not less than 1.60 g/t for open pit mineral reserves and 4.20 g/t for underground mineral reserves (gold cut-off grade for marginal underground mineral reserves from development is 1.60 g/t). |
| 16 Hope Bay: Gold cut-off grade not less than 4.00 g/t. |
| 17 Fosterville: Gold cut-off grade varies according to mining zone and type, not less than 3.10 g/t. |
| 18 Kittila: Gold cut-off grade varies according to haulage distance, not less than 2.63 g/t. |
| 19 Pinos Altos: Net smelter value cut-off varies according to mining zone and type, not less than C$11.09/t for open pit mineral reserves and US$63.43/t for the underground mineral reserves. |
| 20 San Nicolás (50%): Net smelter return cut-off values for low zinc/copper ore of US$9.71/t and for high zinc/copper ore of US$13.15/t. |
| Mineral Resources as at December 31, 2024 | |||||||||||||
| Operation / Project | Measured | Indicated | Measured & Indicated | Inferred | |||||||||
| Gold | Mining Method* | 000Tonnes | g/t | 000 Oz Au | 000 Tonnes | g/t | 000 Oz Au | 000 Tonnes | g/t | 000 Oz Au | 000 Tonnes | g/t | 000 Oz Au |
| LaRonde mine | U/G | — | — | — | 5,851 | 3.75 | 705 | 5,851 | 3.75 | 705 | 1,619 | 5.39 | 281 |
| LaRonde Zone 5 | U/G | — | — | — | 11,094 | 2.29 | 817 | 11,094 | 2.29 | 817 | 7,187 | 4.15 | 960 |
| LaRonde Total | — | — | — | 16,945 | 2.79 | 1,522 | 16,945 | 2.79 | 1,522 | 8,806 | 4.38 | 1,240 | |
| Canadian Malartic mine | O/P | — | — | — | — | — | — | — | — | — | 5,550 | 0.72 | 129 |
| Odyssey deposit | U/G | — | — | — | 1,847 | 1.77 | 105 | 1,847 | 1.77 | 105 | 20,275 | 2.33 | 1,520 |
| East Malartic | U/G | — | — | — | 45,783 | 1.95 | 2,869 | 45,783 | 1.95 | 2,869 | 57,354 | 1.98 | 3,651 |
| East Gouldie | U/G | — | — | — | 5,243 | 1.52 | 257 | 5,243 | 1.52 | 257 | 61,155 | 2.32 | 4,557 |
| Odyssey Total | — | — | — | 52,873 | 1.90 | 3,232 | 52,873 | 1.90 | 3,232 | 138,784 | 2.18 | 9,728 | |
| Canadian Malartic Total | — | — | — | 52,873 | 1.90 | 3,232 | 52,873 | 1.90 | 3,232 | 144,334 | 2.12 | 9,857 | |
| Goldex | U/G | 12,360 | 1.86 | 739 | 18,137 | 1.48 | 865 | 30,496 | 1.64 | 1,604 | 16,946 | 1.62 | 885 |
| Akasaba West | O/P | — | — | — | 4,133 | 0.68 | 90 | 4,133 | 0.68 | 90 | — | — | — |
| Goldex Total | 12,360 | 1.86 | 739 | 22,270 | 1.33 | 955 | 34,630 | 1.52 | 1,694 | 16,946 | 1.62 | 885 | |
| Wasamac | U/G | — | — | — | 9,479 | 2.19 | 667 | 9,479 | 2.19 | 667 | 3,911 | 2.48 | 312 |
| Quebec Total | 12,360 | 1.86 | 739 | 101,567 | 1.95 | 6,376 | 113,927 | 1.94 | 7,115 | 173,997 | 2.20 | 12,294 | |
| Detour Lake | O/P | 33,923 | 1.10 | 1,201 | 630,463 | 0.60 | 12,188 | 664,386 | 0.63 | 13,389 | 65,093 | 1.40 | 2,926 |
| Detour Lake | U/G | — | — | — | 27,738 | 2.10 | 1,870 | 27,738 | 2.10 | 1,870 | 59,269 | 1.93 | 3,679 |
| Detour Lake Zone 58N | U/G | — | — | — | 2,868 | 5.80 | 534 | 2,868 | 5.80 | 534 | 973 | 4.35 | 136 |
| Detour Lake Total | 33,923 | 1.10 | 1,201 | 661,068 | 0.69 | 14,592 | 694,991 | 0.71 | 15,793 | 125,335 | 1.67 | 6,742 | |
| Macassa | U/G | 278 | 8.46 | 76 | 2,716 | 7.39 | 645 | 2,994 | 7.49 | 721 | 5,036 | 7.77 | 1,259 |
| Macassa Near Surface | U/G | — | — | — | 94 | 5.03 | 15 | 94 | 5.03 | 15 | 205 | 4.74 | 31 |
| AK deposit | U/G | — | — | — | 333 | 4.81 | 52 | 333 | 4.81 | 52 | 283 | 3.52 | 32 |
| Macassa Total | 278 | 8.46 | 76 | 3,144 | 7.05 | 712 | 3,422 | 7.16 | 788 | 5,524 | 7.44 | 1,322 | |
| Aquarius | O/P | — | — | — | 12,364 | 2.15 | 856 | 12,364 | 2.15 | 856 | 122 | 3.59 | 14 |
| Holt complex | U/G | 5,806 | 4.29 | 800 | 5,884 | 4.75 | 898 | 11,690 | 4.52 | 1,699 | 9,097 | 4.48 | 1,310 |
| Anoki-McBean | U/G | — | — | — | 3,919 | 2.77 | 349 | 3,919 | 2.77 | 349 | 867 | 3.84 | 107 |
| Upper Beaver | O/P | — | — | — | 54 | 0.87 | 2 | 54 | 0.87 | 2 | — | — | — |
| Upper Beaver | U/G | — | — | — | 7,510 | 2.04 | 493 | 7,510 | 2.04 | 493 | 2,953 | 4.12 | 391 |
| Upper Beaver Total | — | — | — | 7,564 | 2.03 | 495 | 7,564 | 2.03 | 495 | 2,953 | 4.12 | 391 | |
| Upper Canada | O/P | — | — | — | 2,006 | 1.62 | 104 | 2,006 | 1.62 | 104 | 1,020 | 1.44 | 47 |
| Upper Canada | U/G | — | — | — | 8,433 | 2.28 | 618 | 8,433 | 2.28 | 618 | 17,588 | 3.21 | 1,816 |
| Upper Canada Total | — | — | — | 10,439 | 2.15 | 722 | 10,439 | 2.15 | 722 | 18,608 | 3.11 | 1,863 | |
| Hammond Reef | O/P | 47,063 | 0.54 | 819 | 86,304 | 0.53 | 1,478 | 133,367 | 0.54 | 2,298 | — | — | — |
| Ontario Total | 87,070 | 1.03 | 2,896 | 790,685 | 0.79 | 20,104 | 877,755 | 0.82 | 23,000 | 162,506 | 2.25 | 11,748 | |
| Amaruq | O/P | — | — | — | 3,115 | 3.37 | 338 | 3,115 | 3.37 | 338 | 187 | 2.88 | 17 |
| Amaruq | U/G | — | — | — | 6,801 | 4.30 | 940 | 6,801 | 4.30 | 940 | 3,773 | 4.73 | 574 |
| Meadowbank Total | — | — | — | 9,915 | 4.01 | 1,277 | 9,915 | 4.01 | 1,277 | 3,960 | 4.65 | 592 | |
| Meliadine | O/P | 1 | 3.46 | — | 4,229 | 2.98 | 406 | 4,231 | 2.98 | 406 | 614 | 4.43 | 87 |
| Meliadine | U/G | 524 | 4.53 | 76 | 9,187 | 4.17 | 1,232 | 9,711 | 4.19 | 1,308 | 11,082 | 6.00 | 2,138 |
| Operation / Project | Measured | Indicated | Measured & Indicated | Inferred | |||||||||
| Gold | Mining Method* | 000Tonnes | g/t | 000 Oz Au | 000 Tonnes | g/t | 000 Oz Au | 000 Tonnes | g/t | 000 Oz Au | 000 Tonnes | g/t | 000 Oz Au |
| Meliadine Total | 525 | 4.53 | 76 | 13,416 | 3.80 | 1,638 | 13,941 | 3.82 | 1,714 | 11,696 | 5.92 | 2,225 | |
| Hope Bay | U/G | — | — | — | 14,689 | 4.54 | 2,143 | 14,689 | 4.54 | 2,143 | 13,232 | 5.44 | 2,312 |
| Nunavut Total | 525 | 4.53 | 76 | 38,020 | 4.14 | 5,058 | 38,545 | 4.14 | 5,135 | 28,888 | 5.52 | 5,129 | |
| Fosterville | O/P | 843 | 2.79 | 75 | 2,371 | 3.21 | 245 | 3,214 | 3.10 | 320 | 692 | 2.45 | 54 |
| Fosterville | U/G | 474 | 4.27 | 65 | 9,094 | 3.91 | 1,142 | 9,567 | 3.92 | 1,207 | 12,070 | 4.42 | 1,715 |
| Fosterville Total | 1,316 | 3.32 | 141 | 11,465 | 3.76 | 1,386 | 12,781 | 3.72 | 1,527 | 12,761 | 4.31 | 1,769 | |
| Northern Territory | O/P | 269 | 3.65 | 32 | 16,416 | 1.42 | 749 | 16,685 | 1.46 | 781 | 13,536 | 1.75 | 762 |
| Northern Territory | U/G | — | — | — | 5,115 | 5.39 | 887 | 5,115 | 5.39 | 887 | 4,284 | 4.45 | 613 |
| Northern Territory Total | 269 | 3.65 | 32 | 21,531 | 2.36 | 1,636 | 21,800 | 2.38 | 1,668 | 17,820 | 2.40 | 1,376 | |
| Australia Total | 1,585 | 3.38 | 172 | 32,996 | 2.85 | 3,023 | 34,581 | 2.87 | 3,195 | 30,581 | 3.20 | 3,145 | |
| Kittila | O/P | — | — | — | — | — | — | — | — | — | 373 | 3.89 | 47 |
| Kittila | U/G | 4,749 | 2.87 | 438 | 15,079 | 3.01 | 1,461 | 19,828 | 2.98 | 1,899 | 6,038 | 4.97 | 965 |
| Kittila Total | 4,749 | 2.87 | 438 | 15,079 | 3.01 | 1,461 | 19,828 | 2.98 | 1,899 | 6,411 | 4.91 | 1,011 | |
| Barsele (55%) | O/P | — | — | — | 3,178 | 1.08 | 111 | 3,178 | 1.08 | 111 | 2,260 | 1.25 | 91 |
| Barsele (55%) | U/G | — | — | — | 1,158 | 1.77 | 66 | 1,158 | 1.77 | 66 | 13,552 | 2.10 | 914 |
| Barsele Total | — | — | — | 4,335 | 1.27 | 176 | 4,335 | 1.27 | 176 | 15,811 | 1.98 | 1,005 | |
| Europe Total | 4,749 | 2.87 | 438 | 19,414 | 2.62 | 1,638 | 24,163 | 2.67 | 2,076 | 22,222 | 2.82 | 2,016 | |
| Pinos Altos | O/P | — | — | — | 1,248 | 0.79 | 32 | 1,248 | 0.79 | 32 | 106 | 0.60 | 2 |
| Pinos Altos | U/G | — | — | — | 9,798 | 2.25 | 709 | 9,798 | 2.25 | 709 | 972 | 1.79 | 56 |
| Pinos Altos Total | — | — | — | 11,045 | 2.09 | 741 | 11,045 | 2.09 | 741 | 1,077 | 1.67 | 58 | |
| La India | O/P | 4,478 | 0.52 | 74 | 880 | 0.53 | 15 | 5,358 | 0.52 | 89 | — | — | — |
| San Nicolás (50%) | O/P | 261 | 0.08 | 1 | 3,037 | 0.20 | 19 | 3,297 | 0.19 | 20 | 2,468 | 0.13 | 10 |
| Tarachi | O/P | — | — | — | 19,290 | 0.58 | 361 | 19,290 | 0.58 | 361 | 242 | 0.52 | 4 |
| Chipriona | O/P | — | — | — | 10,983 | 0.92 | 326 | 10,983 | 0.92 | 326 | 976 | 0.66 | 21 |
| El Barqueño Gold | O/P | — | — | — | 8,834 | 1.16 | 331 | 8,834 | 1.16 | 331 | 9,628 | 1.13 | 351 |
| Santa Gertrudis | O/P | — | — | — | 19,267 | 0.91 | 563 | 19,267 | 0.91 | 563 | 9,819 | 1.36 | 429 |
| Santa Gertrudis | U/G | — | — | — | — | — | — | — | — | — | 9,079 | 3.44 | 1,004 |
| Santa Gertrudis Total | — | — | — | 19,267 | 0.91 | 563 | 19,267 | 0.91 | 563 | 18,898 | 2.36 | 1,433 | |
| Total Mexico | 4,739 | 0.49 | 75 | 73,336 | 1.00 | 2,355 | 78,075 | 0.97 | 2,430 | 33,289 | 1.75 | 1,876 | |
| Total Gold | 111,028 | 1.23 | 4,397 | 1,056,019 | 1.14 | 38,553 | 1,167,047 | 1.14 | 42,950 | 451,483 | 2.49 | 36,208 | |
| Operation / Project | Measured | Indicated | Measured & Indicated | Inferred | |||||||||
| Silver | Mining Method* | 000 Tonnes | g/t | 000 Oz Ag | 000 Tonnes | g/t | 000 Oz Ag | 000 Tonnes | g/t | 000 Oz Ag | 000 Tonnes | g/t | 000 Oz Ag |
| LaRonde mine | U/G | — | — | — | 5,851 | 15.28 | 2,873 | 5,851 | 15.28 | 2,873 | 1,619 | 11.14 | 580 |
| Pinos Altos | O/P | — | — | — | 1,248 | 19.20 | 770 | 1,248 | 19.20 | 770 | 106 | 12.38 | 42 |
| Pinos Altos | U/G | — | — | — | 9,798 | 50.88 | 16,028 | 9,798 | 50.88 | 16,028 | 972 | 41.51 | 1,297 |
| Pinos Altos Total | — | — | — | 11,045 | 47.30 | 16,798 | 11,045 | 47.30 | 16,798 | 1,077 | 38.65 | 1,339 | |
| La India | O/P | 4,478 | 2.72 | 391 | 880 | 2.58 | 73 | 5,358 | 2.70 | 464 | — | — | — |
| San Nicolás (50%) | O/P | 261 | 6.40 | 54 | 3,037 | 11.86 | 1,158 | 3,297 | 11.43 | 1,211 | 2,468 | 9.26 | 735 |
| Chipriona | O/P | — | — | — | 10,983 | 100.72 | 35,566 | 10,983 | 100.72 | 35,566 | 976 | 86.77 | 2,722 |
| El Barqueño Silver | O/P | — | — | — | — | — | — | — | — | — | 4,393 | 124.06 | 17,523 |
| El Barqueño Gold | O/P | — | — | — | 8,834 | 4.73 | 1,343 | 8,834 | 4.73 | 1,343 | 9,628 | 16.86 | 5,218 |
| Santa Gertrudis | O/P | — | — | — | 19,267 | 3.66 | 2,269 | 19,267 | 3.66 | 2,269 | 9,819 | 1.85 | 585 |
| Santa Gertrudis | U/G | — | — | — | — | — | — | — | — | — | 9,079 | 23.31 | 6,803 |
| Santa Gertrudis Total | — | — | — | 19,267 | 3.66 | 2,269 | 19,267 | 3.66 | 2,269 | 18,898 | 12.16 | 7,389 | |
| Total Silver | 4,739 | 2.92 | 445 | 59,897 | 31.20 | 60,080 | 64,636 | 29.13 | 60,525 | 39,058 | 28.27 | 35,504 | |
| Copper | Mining Method* | 000 Tonnes | % | Tonnes Cu | 000 Tonnes | % | Tonnes Cu | 000 Tonnes | % | Tonnes Cu | 000 Tonnes | % | Tonnes Cu |
| LaRonde mine | U/G | — | — | — | 5,851 | 0.14 | 8,213 | 5,851 | 0.14 | 8,213 | 1,619 | 0.25 | 4,101 |
| Akasaba West | O/P | — | — | — | 4,133 | 0.41 | 17,126 | 4,133 | 0.41 | 17,126 | — | — | — |
| Upper Beaver | O/P | — | — | — | 54 | 0.10 | 56 | 54 | 0.1 | 56 | — | — | — |
| Upper Beaver | U/G | — | — | — | 7,510 | 0.16 | 12,063 | 7,510 | 0.16 | 12,063 | 2,953 | 0.36 | 10,649 |
| Upper Beaver Total | — | — | — | 7,564 | 0.16 | 12,118 | 7,564 | 0.16 | 12,118 | 2,953 | 0.36 | 10,649 | |
| San Nicolás (50%) | O/P | 261 | 1.35 | 3,526 | 3,037 | 1.17 | 35,489 | 3,297 | 1.18 | 39,015 | 2,468 | 0.94 | 23,144 |
| Chipriona | O/P | — | — | — | 10,983 | 0.16 | 17,291 | 10,983 | 0.16 | 17,291 | 976 | 0.12 | 1,174 |
| El Barqueño Gold | O/P | — | — | — | 8,834 | 0.19 | 16,400 | 8,834 | 0.19 | 16,400 | 9,628 | 0.22 | 21,152 |
| El Barqueño Silver | O/P | — | — | — | — | — | — | — | — | — | 4,393 | 0.04 | 1,854 |
| Total Copper | 261 | 1.35 | 3,526 | 40,402 | 0.26 | 106,637 | 40,662 | 0.27 | 110,163 | 22,036 | 0.28 | 62,075 | |
| Zinc | Mining Method* | 000 Tonnes | % | Tonnes Zn | 000 Tonnes | % | Tonnes Zn | 000 Tonnes | % | Tonnes Zn | 000 Tonnes | % | Tonnes Zn |
| LaRonde mine | U/G | — | — | — | 5,851 | 1.00 | 58,633 | 5,851 | 1 | 58,633 | 1,619 | 0.34 | 5,520 |
| San Nicolás (50%) | O/P | 261 | 0.39 | 1,012 | 3,037 | 0.71 | 21,618 | 3,297 | 0.69 | 22,630 | 2,468 | 0.62 | 15,355 |
| Chipriona | O/P | — | — | — | 10,983 | 0.83 | 91,637 | 10,983 | 0.83 | 91,637 | 976 | 0.73 | 7,073 |
| Total Zinc | 261 | 0.39 | 1,012 | 19,870 | 0.87 | 171,888 | 20,131 | 0.86 | 172,900 | 5,062 | 0.55 | 27,949 |
| *Open Pit (“O/P”), Underground (“U/G”) |
Assumptions used for the December 31, 2024 mineral reserve and mineral resource estimates reported by the Company
| Metal Price for Mineral Reserve Estimation* | |||
| Gold ($/oz) | Silver ($/oz) | Copper ($/lb) | Zinc ($/lb) |
| $1,450 | $20.00 | $3.75 | $1.10 |
| *Exceptions: US$1,350 per ounce of gold used for Hammond Reef and Hope Bay; US$1,400 per ounce of gold used for Detour Lake open pit; US$1,650 per ounce of gold used for Wasamac and Amaruq; US$1,800 per ounce of gold and US$24.00 per ounce of silver used for Pinos Altos; and US$1,300 per ounce of gold and US$3.00 per pound of copper used for San Nicolás. |
| Metal Price for Mineral Resource Estimation* | |||
| Gold ($/oz) | Silver ($/oz) | Copper ($/lb) | Zinc ($/lb) |
| $1,750 | $23.00 | $4.00 | $1.20 |
| *Exceptions: US$1,200 per ounce of gold used for Holt complex; US$1,300 per ounce of gold used for Detour Zone 58N; US$1,450 per ounce of gold used for Canadian Malartic; US$1,500 per ounce of gold used for Northern Territory; US$1,533 per ounce of gold used for Barsele; US$1,650 per ounce of gold used for Detour Lake, La India and Chipriona; US$1,667 per ounce of gold used for Upper Canada and El Barqueño; US$22.67 per ounce of silver used for El Barqueño; US$1,688 per ounce of gold used for Anoki-McBean, Hammond Reef and Tarachi; US$1,688 per ounce of gold and US$25.00 per ounce of silver used for Santa Gertrudis; US$1,300 per ounce of gold, US$20.00 per ounce of silver, US$3.00 per pound of copper and US$1.10 per pound of zinc used for San Nicolás; and US$1,800 per ounce of gold and US$24.00 per ounce of silver used for Pinos Altos. |
| Exchange Rates* | |||
| C$ per US$1.00 | MXP per US$1.00 | A$ per US$1.00 | € per US$1.00 |
| C$1.34 | MXP18.00 | A$1.45 | €0.91 |
| *Exceptions: exchange rates of C$1.25 per US$1.00 used for Upper Canada, Holt complex and Detour Lake Zone 58N; C$1.30 per US$1.00 used for Detour Lake open pit, Detour Lake underground, Hammond Reef and Hope Bay; EUR 0.87 per US$1.00 used for Barsele; and MXP17.00 per US$1.00 used for Tarachi. |
The above metal price assumptions are all below the three-year historic averages (from January 1, 2022 to December 31, 2024) of approximately $2,053 per ounce of gold, $24.58 per ounce of silver, $4.02 per pound of copper and $1.34 per pound of zinc.
Mineral reserves reported are not included in mineral resources. Tonnage amounts and contained metal amounts set out in this table have been rounded to the nearest thousand, so may not aggregate to equal column totals. Mineral reserves are in-situ, taking into account all mining recoveries, before mill or heap leach recoveries. Underground mineral reserves and measured and indicated mineral resources are reported within mineable shapes and include internal and external dilution. Inferred mineral resources are reported within mineable shapes and include internal dilution. Mineable shape optimization parameters may differ for mineral reserves and mineral resources.
The mineral reserves and mineral resources tonnages reported for silver, copper and zinc are a subset of the mineral reserves and mineral resources tonnages for gold. The Company’s economic parameters set the maximum price allowed to be no more than the lesser of the three‐year moving average and current spot price, which is a common industry standard. Given the current commodity price environment, Agnico Eagle continues to use more conservative gold and silver prices.
NI 43-101 requires mining companies to disclose mineral reserves and mineral resources using the subcategories of “proven mineral reserves”, “probable mineral reserves”, “measured mineral resources”, “indicated mineral resources” and “inferred mineral resources”. Mineral resources that are not mineral reserves do not have demonstrated economic viability.
A mineral reserve is the economically mineable part of a measured and/or indicated mineral resource. It includes diluting materials and allowances for losses, which may occur when the material is mined or extracted and is defined by studies at prefeasibility or feasibility level as appropriate that include application of modifying factors. Such studies demonstrate that, at the time of reporting, extraction could reasonably be justified. The mineral reserves presented in this news release are separate from and not a portion of the mineral resources.
Modifying factors are considerations used to convert mineral resources to mineral reserves. These include, but are not restricted to, mining, processing, metallurgical, infrastructure, economic, marketing, legal, environmental, social and governmental factors.
A proven mineral reserve is the economically mineable part of a measured mineral resource. A proven mineral reserve implies a high degree of confidence in the modifying factors. A probable mineral reserve is the economically mineable part of an indicated and, in some circumstances, a measured mineral resource. The confidence in the modifying factors applied to a probable mineral reserve is lower than that applied to a proven mineral reserve.
A mineral resource is a concentration or occurrence of solid material of economic interest in or on the Earth’s crust in such form, grade or quality and quantity that there are reasonable prospects for eventual economic extraction. The location, quantity, grade or quality, continuity and other geological characteristics of a mineral resource are known, estimated or interpreted from specific geological evidence and knowledge, including sampling.
A measured mineral resource is that part of a mineral resource for which quantity, grade or quality, densities, shape and physical characteristics are estimated with confidence sufficient to allow the application of modifying factors to support detailed mine planning and final evaluation of the economic viability of the deposit. Geological evidence is derived from detailed and reliable exploration, sampling and testing and is sufficient to confirm geological and grade or quality continuity between points of observation. An indicated mineral resource is that part of a mineral resource for which quantity, grade or quality, densities, shape and physical characteristics are estimated with sufficient confidence to allow the application of modifying factors in sufficient detail to support mine planning and evaluation of the economic viability of the deposit. Geological evidence is derived from adequately detailed and reliable exploration, sampling and testing and is sufficient to assume geological and grade or quality continuity between points of observation. An inferred mineral resource is that part of a mineral resource for which quantity and grade or quality are estimated on the basis of limited geological evidence and sampling. Geological evidence is sufficient to imply but not verify geological and grade or quality continuity.
Investors are cautioned not to assume that part or all of an inferred mineral resource exists, or is economically or legally mineable.
A feasibility study is a comprehensive technical and economic study of the selected development option for a mineral project that includes appropriately detailed assessments of applicable modifying factors, together with any other relevant operational factors and detailed financial analysis that are necessary to demonstrate, at the time of reporting, that extraction is reasonably justified (economically mineable). The results of the study may reasonably serve as the basis for a final decision by a proponent or financial institution to proceed with, or finance, the development of the project. The confidence level of the study will be higher than that of a pre-feasibility study.
Additional Information
Additional information about each of the Company’s material mineral projects as at December 31, 2024, including information regarding data verification, key assumptions, parameters and methods used to estimate mineral reserves and mineral resources and the risks that could materially affect the development of the mineral reserves and mineral resources required by sections 3.2 and 3.3 and paragraphs 3.4(a), (c) and (d) of NI 43-101 can be found in the Company’s AIF and MD&A filed on SEDAR+ each of which forms a part of the Company’s Form 40-F filed with the SEC on EDGAR and in the following technical reports filed on SEDAR+ in respect of the Company’s material mineral properties: Detour Lake Operation, Ontario, Canada, NI 43-101 Technical Report (September 20, 2024); NI 43-101 Technical Report of the LaRonde complex in Québec, Canada (March 24, 2023); NI 43-101 Technical Report Canadian Malartic Mine, Québec, Canada (March 25, 2021); Technical Report on the Mineral Resources and Mineral Reserves at Meadowbank Gold complex including the Amaruq Satellite Mine Development, Nunavut, Canada as at December 31, 2017 (February 14, 2018); and the Updated Technical Report on the Meliadine Gold Project, Nunavut, Canada (February 11, 2015).
APPENDIX – FINANCIAL INFORMATION
| AGNICO EAGLE MINES LIMITED | |||||||
| SUMMARY OF OPERATIONS KEY PERFORMANCE INDICATORS | |||||||
| (thousands of United States dollars, except where noted) | |||||||
| Three Months EndedDecember 31, | Year EndedDecember 31, | ||||||
| 2024 | 2023 | 2024 | 2023 | ||||
| (Restated)(i) | (Restated)(i) | ||||||
| Net income – key line items: | |||||||
| Revenue from mine operations: | |||||||
| Quebec | |||||||
| LaRonde mine | 153,040 | 120,081 | 588,839 | 483,065 | |||
| LZ5 | 54,083 | 31,341 | 181,475 | 130,711 | |||
| Canadian Malartic(iii) | 399,755 | 330,491 | 1,492,313 | 1,124,480 | |||
| Goldex | 84,042 | 62,999 | 321,346 | 272,801 | |||
| Ontario | |||||||
| Detour Lake | 442,681 | 351,020 | 1,582,974 | 1,262,839 | |||
| Macassa | 215,365 | 115,682 | 670,568 | 431,827 | |||
| Nunavut | |||||||
| Meliadine | 259,519 | 190,374 | 890,243 | 697,431 | |||
| Meadowbank | 305,085 | 241,697 | 1,178,132 | 858,209 | |||
| Australia | |||||||
| Fosterville | 111,723 | 98,177 | 545,152 | 552,468 | |||
| Europe | |||||||
| Kittila | 127,675 | 116,103 | 523,550 | 448,719 | |||
| Mexico | |||||||
| Pinos Altos | 61,471 | 56,649 | 245,997 | 212,876 | |||
| La India | 9,261 | 42,026 | 65,164 | 151,483 | |||
| Revenues from mining operations | $ 2,223,700 | $ 1,756,640 | $ 8,285,753 | $ 6,626,909 | |||
| Production costs | 746,858 | 777,455 | 3,086,080 | 2,933,263 | |||
| Total operating margin(ii) | 1,476,842 | 979,185 | 5,199,673 | 3,693,646 | |||
| Amortization of property, plant and mine development | 388,217 | 380,407 | 1,514,076 | 1,491,771 | |||
| Revaluation gain(iv) | — | — | — | (1,543,414) | |||
| Exploration, corporate and other | 306,114 | 124,711 | 864,042 | 599,220 | |||
| Income (loss) before income and mining taxes | 782,511 | (312,933) | 2,821,555 | 2,359,069 | |||
| Income and mining taxes expense | 273,256 | 61,124 | 925,974 | 417,762 | |||
| Net income (loss) for the period | $ 509,255 | $ (374,057) | $ 1,895,581 | $ 1,941,307 | |||
| Net income (loss) per share — basic | $ 1.02 | $ (0.75) | $ 3.79 | $ 3.97 | |||
| Net income (loss) per share — diluted | $ 1.01 | $ (0.75) | $ 3.78 | $ 3.95 | |||
| Cash flows: | |||||||
| Cash provided by operating activities | $ 1,131,849 | $ 727,861 | $ 3,960,892 | $ 2,601,562 | |||
| Cash used in investing activities | $ (631,557) | $ (476,170) | $ (2,007,114) | $ (2,760,783) | |||
| Cash used in provided by financing activities | $ (542,518) | $ (273,801) | $ (1,356,331) | $ (163,958) | |||
| Realized prices: | |||||||
| Gold (per ounce) | $ 2,660 | $ 1,982 | $ 2,384 | $ 1,946 | |||
| Silver (per ounce) | $ 30.31 | $ 23.88 | $ 28.85 | $ 23.72 | |||
| Zinc (per tonne) | $ 2,955 | $ 2,700 | $ 2,755 | $ 2,705 | |||
| Copper (per tonne) | $ 9,193 | $ 7,828 | $ 9,291 | $ 8,282 |
| AGNICO EAGLE MINES LIMITED | |||||||
| SUMMARY OF OPERATIONS KEY PERFORMANCE INDICATORS | |||||||
| (thousands of United States dollars, except where noted) | |||||||
| Three Months EndedDecember 31, | Year EndedDecember 31, | ||||||
| 2024 | 2023 | 2024 | 2023 | ||||
| Payable production(v): | |||||||
| Gold (ounces): | |||||||
| Quebec | |||||||
| LaRonde mine | 66,124 | 68,520 | 227,512 | 235,991 | |||
| LZ5 | 24,323 | 17,245 | 79,238 | 70,657 | |||
| Canadian Malartic(iii) | 146,485 | 168,272 | 655,654 | 603,955 | |||
| Goldex | 32,341 | 33,364 | 130,813 | 140,983 | |||
| Ontario | |||||||
| Detour Lake | 179,061 | 193,475 | 671,950 | 677,446 | |||
| Macassa | 76,336 | 60,584 | 279,384 | 228,535 | |||
| Nunavut | |||||||
| Meliadine | 94,648 | 96,285 | 378,886 | 364,141 | |||
| Meadowbank | 117,024 | 109,226 | 504,719 | 431,666 | |||
| Australia | |||||||
| Fosterville | 37,139 | 49,533 | 225,203 | 277,694 | |||
| Europe | |||||||
| Kittila | 51,893 | 61,172 | 218,860 | 234,402 | |||
| Mexico | |||||||
| Pinos Altos | 18,583 | 25,963 | 88,433 | 97,642 | |||
| Creston Mascota | 54 | 88 | 104 | 638 | |||
| La India | 3,390 | 19,481 | 24,580 | 75,904 | |||
| Total gold (ounces): | 847,401 | 903,208 | 3,485,336 | 3,439,654 | |||
| Silver (thousands of ounces) | 640 | 655 | 2,485 | 2,408 | |||
| Zinc (tonnes) | 1,860 | 1,384 | 6,339 | 7,702 | |||
| Copper (tonnes) | 1,278 | 682 | 3,951 | 2,617 | |||
| AGNICO EAGLE MINES LIMITED | |||||||
| SUMMARY OF OPERATIONS KEY PERFORMANCE INDICATORS | |||||||
| (thousands of United States dollars, except where noted) | |||||||
| Three Months EndedDecember 31, | Year EndedDecember 31, | ||||||
| 2024 | 2023 | 2024 | 2023 | ||||
| Payable metal sold(vi): | |||||||
| Gold (ounces): | |||||||
| Quebec | |||||||
| LaRonde mine | 53,525 | 54,043 | 228,611 | 226,538 | |||
| LZ5 | 20,647 | 16,042 | 76,083 | 68,174 | |||
| Canadian Malartic(iii) | 148,753 | 165,518 | 624,646 | 570,558 | |||
| Goldex | 29,501 | 31,692 | 129,397 | 140,240 | |||
| Ontario | |||||||
| Detour Lake | 166,057 | 177,083 | 663,272 | 650,405 | |||
| Macassa | 80,624 | 58,100 | 278,464 | 222,530 | |||
| Nunavut | |||||||
| Meliadine | 97,898 | 96,320 | 374,776 | 358,485 | |||
| Meadowbank | 114,497 | 121,831 | 492,620 | 439,415 | |||
| Australia | |||||||
| Fosterville | 41,900 | 49,000 | 229,147 | 284,250 | |||
| Europe | |||||||
| Kittila | 48,100 | 59,000 | 219,548 | 230,060 | |||
| Mexico | |||||||
| Pinos Altos | 19,900 | 25,000 | 89,410 | 96,134 | |||
| La India | 3,500 | 21,000 | 28,120 | 77,343 | |||
| Total gold (ounces): | 824,902 | 874,629 | 3,434,094 | 3,364,132 | |||
| Silver (thousands of ounces) | 669 | 634 | 2,483 | 2,354 | |||
| Zinc (tonnes) | 1,407 | 1,544 | 6,209 | 8,526 | |||
| Copper (tonnes) | 1,271 | 692 | 3,952 | 2,630 | |||
| AGNICO EAGLE MINES LIMITED | |||||||
| SUMMARY OF OPERATIONS KEY PERFORMANCE INDICATORS | |||||||
| (thousands of United States dollars, except where noted) | |||||||
| Three Months EndedDecember 31, | Year EndedDecember 31, | ||||||
| 2024 | 2023 | 2024 | 2023 | ||||
| Total cash costs per ounce — co-product basis(vii): | |||||||
| Quebec | |||||||
| LaRonde mine | $ 1,031 | $ 995 | $ 1,137 | $ 1,067 | |||
| LZ5 | 990 | 966 | 1,118 | 1,158 | |||
| Canadian Malartic(iii) | 1,030 | 925 | 943 | 835 | |||
| Goldex | 1,047 | 887 | 1,041 | 822 | |||
| Ontario | |||||||
| Detour Lake | 761 | 695 | 801 | 738 | |||
| Macassa | 712 | 766 | 752 | 733 | |||
| Nunavut | |||||||
| Meliadine | 1,039 | 993 | 942 | 981 | |||
| Meadowbank | 998 | 1,193 | 946 | 1,183 | |||
| Australia | |||||||
| Fosterville | 881 | 723 | 650 | 489 | |||
| Europe | |||||||
| Kittila | 1,029 | 860 | 1,033 | 872 | |||
| Mexico | |||||||
| Pinos Altos | 2,372 | 1,502 | 1,925 | 1,509 | |||
| La India | 1,848 | 1,172 | 1,987 | 1,261 | |||
| Total cash costs per ounce (co-product basis) | $ 966 | $ 916 | $ 940 | $ 893 | |||
| Total cash costs per ounce — by-product basis(vii): | |||||||
| Quebec | |||||||
| LaRonde mine | $ 780 | $ 814 | $ 889 | $ 840 | |||
| LZ5 | 980 | 965 | 1,105 | 1,148 | |||
| Canadian Malartic(iii) | 1,014 | 913 | 930 | 824 | |||
| Goldex | 859 | 877 | 923 | 820 | |||
| Ontario | |||||||
| Detour Lake | 755 | 691 | 796 | 735 | |||
| Macassa | 708 | 763 | 748 | 731 | |||
| Nunavut | |||||||
| Meliadine | 1,037 | 992 | 940 | 980 | |||
| Meadowbank | 988 | 1,186 | 938 | 1,176 | |||
| Australia | |||||||
| Fosterville | 878 | 723 | 647 | 488 | |||
| Europe | |||||||
| Kittila | 1,026 | 858 | 1,031 | 871 | |||
| Mexico | |||||||
| Pinos Altos | 1,921 | 1,210 | 1,530 | 1,229 | |||
| La India | 1,835 | 1,149 | 1,945 | 1,241 | |||
| Total cash costs per ounce (by-product basis) | $ 923 | $ 888 | $ 903 | $ 865 |
| Notes: | |||||||
| (i) Certain previously reported line items have been restated to reflect the final purchase price allocation of Canadian Malartic. | |||||||
| (ii) Operating margin is not a recognized measure under IFRS and this data may not be comparable to data reported by other gold producers. See Note Regarding Certain Measures of Performance – Operating Margin for more information on the Company’s calculation and use of operating margin. | |||||||
| (iii) The information set out in this table reflects the Company’s 50% interest in Canadian Malartic up to and including March 30, 2023 and 100% interest thereafter following the closing of the Yamana Transaction. | |||||||
| (iv) Revaluation gain on the 50% interest the Company owned in Canadian Malartic prior to the Yamana Transaction. | |||||||
| (v) Payable production (a non-GAAP non-financial performance measure) is the quantity of mineral produced during a period contained in products that are or will be sold by the Company, whether such products are sold during the period or held as inventories at the end of the period. | |||||||
| (vi) Canadian Malartic payable metal sold excludes the 5.0% in-kind net smelter return royalty held by Osisko Gold Royalties Ltd. Detour Lake payable metal sold excludes the 2.0% in-kind net smelter royalty held by Franco-Nevada Corporation. Macassa payable metal sold excludes the 1.5% in-kind net smelter royalty held by Franco-Nevada Corporation. | |||||||
| (vii) The total cash costs per ounce is not a recognized measure under IFRS and this data may not be comparable to data reported by other gold producers. See Note Regarding Certain Measures of Performance – Total Cash Costs per Ounce and Minesite Costs per Tonne for a discussion on the composition and usefulness of these measures and a reconciliation to the most directly comparable financial information prepared in accordance with IFRS. |
| AGNICO EAGLE MINES LIMITED | |||
| CONSOLIDATED BALANCE SHEETS | |||
| (thousands of United States dollars, except share amounts, IFRS basis) | |||
| As at | As at | ||
| December 31, 2024 | December 31, 2023 | ||
| ASSETS | |||
| Current assets: | |||
| Cash and cash equivalents | $ 926,431 | $ 338,648 | |
| Inventories | 1,510,716 | 1,418,941 | |
| Income taxes recoverable | 26,432 | 27,602 | |
| Fair value of derivative financial instruments | 1,348 | 50,786 | |
| Other current assets | 340,354 | 355,175 | |
| Total current assets | 2,805,281 | 2,191,152 | |
| Non-current assets: | |||
| Goodwill | 4,157,672 | 4,157,672 | |
| Property, plant and mine development | 21,466,499 | 21,221,905 | |
| Investments | 612,889 | 345,257 | |
| Deferred income and mining tax asset | 29,198 | 53,796 | |
| Other assets | 915,479 | 715,167 | |
| Total assets | $ 29,987,018 | $ 28,684,949 | |
| LIABILITIES | |||
| Current liabilities: | |||
| Accounts payable and accrued liabilities | $ 817,649 | $ 750,380 | |
| Share based liabilities | 27,290 | 24,316 | |
| Interest payable | 5,763 | 14,226 | |
| Income taxes payable | 372,197 | 81,222 | |
| Current portion of long-term debt | 90,000 | 100,000 | |
| Reclamation provision | 58,579 | 24,266 | |
| Lease obligations | 40,305 | 46,394 | |
| Fair value of derivative financial instruments | 100,182 | 7,222 | |
| Total current liabilities | 1,511,965 | 1,048,026 | |
| Non-current liabilities: | |||
| Long-term debt | 1,052,956 | 1,743,086 | |
| Reclamation provision | 1,026,628 | 1,049,238 | |
| Lease obligations | 98,921 | 115,154 | |
| Share based liabilities | 12,505 | 11,153 | |
| Deferred income and mining tax liabilities | 5,162,249 | 4,973,271 | |
| Other liabilities | 288,894 | 322,106 | |
| Total liabilities | 9,154,118 | 9,262,034 | |
| EQUITY | |||
| Common shares: | |||
| Outstanding – 502,440,336 common shares issued, less 710,831 shares held in trust | 18,675,660 | 18,334,869 | |
| Stock options | 172,145 | 201,755 | |
| Contributed surplus | — | 22,074 | |
| Retained earnings | 2,026,242 | 963,172 | |
| Other reserves | (41,147) | (98,955) | |
| Total equity | 20,832,900 | 19,422,915 | |
| Total liabilities and equity | $ 29,987,018 | $ 28,684,949 |
| AGNICO EAGLE MINES LIMITED | |||||||
| CONSOLIDATED STATEMENTS OF INCOME (LOSS) | |||||||
| (thousands of United States dollars, except per share amounts, IFRS basis) | |||||||
| Three Months EndedDecember 31, | Year EndedDecember 31, | ||||||
| 2024 | 2023 | 2024 | 2023 | ||||
| Restated(i) | |||||||
| REVENUES | |||||||
| Revenues from mining operations | $ 2,223,700 | $ 1,756,640 | $ 8,285,753 | $ 6,626,909 | |||
| COSTS, INCOME AND EXPENSES | |||||||
| Production(ii) | 746,858 | 777,455 | 3,086,080 | 2,933,263 | |||
| Exploration and corporate development | 52,822 | 45,997 | 219,610 | 215,781 | |||
| Amortization of property, plant and mine development | 388,217 | 380,407 | 1,514,076 | 1,491,771 | |||
| General and administrative | 62,014 | 74,001 | 207,450 | 208,451 | |||
| Finance costs | 27,473 | 35,098 | 126,738 | 130,087 | |||
| Loss (gain) on derivative financial instruments | 107,429 | (69,470) | 155,819 | (68,432) | |||
| Impairment loss | — | 787,000 | — | 787,000 | |||
| Foreign currency translation loss (gain) | 10,131 | 1,930 | 9,383 | (328) | |||
| Care and maintenance | 25,496 | 14,375 | 60,574 | 47,392 | |||
| Revaluation gain(iii) | — | — | — | (1,543,414) | |||
| Other expenses | 20,749 | 22,780 | 84,468 | 66,269 | |||
| Income (loss) before income and mining taxes | 782,511 | (312,933) | 2,821,555 | 2,359,069 | |||
| Income and mining taxes expense | 273,256 | 61,124 | 925,974 | 417,762 | |||
| Net income (loss) for the period | $ 509,255 | $ (374,057) | $ 1,895,581 | $ 1,941,307 | |||
| Net income (loss) per share – basic | $ 1.02 | $ (0.75) | $ 3.79 | $ 3.97 | |||
| Net income (loss) per share – diluted | $ 1.01 | $ (0.75) | $ 3.78 | $ 3.95 | |||
| Adjusted net income per share – basic(iv) | $ 1.26 | $ 0.58 | $ 4.24 | $ 2.24 | |||
| Adjusted net income per share – diluted(iv) | $ 1.26 | $ 0.58 | $ 4.23 | $ 2.23 | |||
| Weighted average number of common shares outstanding (in thousands): | |||||||
| Basic | 501,585 | 496,499 | 499,904 | 488,723 | |||
| Diluted | 502,880 | 497,076 | 500,861 | 489,913 |
| Notes: | |||||||
| (i) Certain previously reported line items have been restated to reflect the final purchase price allocation of the Yamana Transaction. | |||||||
| (ii) Exclusive of amortization, which is shown separately. | |||||||
| (iii) Revaluation gain on the 50% interest previously owned in Canadian Malartic prior to the Yamana Transaction. | |||||||
| (iv) Adjusted net income per share is not a recognized measure under IFRS and this data may not be comparable to data reported by other companies. See Note Regarding Certain Measures of Performance – Adjusted Net Income and Adjusted Net Income per Share for a discussion of the composition and usefulness of this measure and a reconciliation to the nearest IFRS measure. |
| AGNICO EAGLE MINES LIMITED | |||||||
| CONSOLIDATED STATEMENTS OF CASH FLOWS | |||||||
| (thousands of United States dollars, IFRS basis) | |||||||
| Three Months EndedDecember 31, | Year EndedDecember 31, | ||||||
| 2024 | 2023 | 2024 | 2023 | ||||
| Restated(i) | |||||||
| OPERATING ACTIVITIES | |||||||
| Net income (loss) for the period | $ 509,255 | $ (374,057) | $ 1,895,581 | $ 1,941,307 | |||
| Add (deduct) adjusting items: | |||||||
| Amortization of property, plant and mine development | 388,217 | 380,407 | 1,514,076 | 1,491,771 | |||
| Revaluation gain(ii) | — | — | — | (1,543,414) | |||
| Deferred income and mining taxes | 61,057 | (14,753) | 213,845 | 52,041 | |||
| Unrealized loss (gain) on currency and commodity derivatives | 104,033 | (78,016) | 142,396 | (112,904) | |||
| Unrealized (gain) loss on warrants | (16,480) | 2,100 | (20,383) | 11,198 | |||
| Stock-based compensation | 18,447 | 33,087 | 77,404 | 71,553 | |||
| Impairment loss | — | 787,000 | — | 787,000 | |||
| Foreign currency translation loss (gain) | 10,131 | 1,930 | 9,383 | (328) | |||
| Other | 15,422 | 39,781 | 48,566 | 49,734 | |||
| Changes in non-cash working capital balances: | |||||||
| Income taxes | 116,595 | 21,870 | 259,327 | 103,850 | |||
| Inventories | (42,573) | (24,170) | (208,300) | (169,168) | |||
| Other current assets | 17,403 | 6,016 | 1,166 | (80,931) | |||
| Accounts payable and accrued liabilities | (37,896) | (48,649) | 36,726 | 2,778 | |||
| Interest payable | (11,762) | (4,685) | (8,895) | (2,925) | |||
| Cash provided by operating activities | 1,131,849 | 727,861 | 3,960,892 | 2,601,562 | |||
| INVESTING ACTIVITIES | |||||||
| Additions to property, plant and mine development | (562,163) | (425,742) | (1,817,949) | (1,654,129) | |||
| Yamana transaction, net of cash and cash equivalents | — | — | — | (1,000,617) | |||
| Contributions for acquisition of mineral assets | (5,000) | — | (16,296) | (10,950) | |||
| Purchases of equity securities and other investments | (68,377) | (52,612) | (183,021) | (104,738) | |||
| Other investing activities | 3,983 | 2,184 | 10,152 | 9,651 | |||
| Cash used in investing activities | (631,557) | (476,170) | (2,007,114) | (2,760,783) | |||
| FINANCING ACTIVITIES | |||||||
| Proceeds from Credit Facility | — | 200,000 | 600,000 | 1,300,000 | |||
| Repayment of Credit Facility | — | (300,000) | (600,000) | (1,300,000) | |||
| Proceeds from Term Loan Facility, net of financing costs | — | — | — | 598,958 | |||
| Repayment of Term Loan Facility | (325,000) | — | (600,000) | — | |||
| Repayment of Senior Notes | — | — | (100,000) | (100,000) | |||
| Long-term debt financing costs | — | — | (3,544) | — | |||
| Repayment of lease obligations | (9,177) | (11,956) | (47,319) | (47,589) | |||
| Dividends paid | (173,826) | (155,962) | (671,655) | (638,642) | |||
| Repurchase of common shares | (63,236) | (30,653) | (169,357) | (47,003) | |||
| Proceeds on exercise of stock options | 19,797 | 16,854 | 198,532 | 40,377 | |||
| Common shares issued | 8,924 | 7,916 | 37,012 | 29,941 | |||
| Cash used in financing activities | (542,518) | (273,801) | (1,356,331) | (163,958) | |||
| Effect of exchange rate changes on cash and cash equivalents | (8,558) | 5,267 | (9,664) | 3,202 | |||
| Net (decrease) increase in cash and cash equivalents during the period | (50,784) | (16,843) | 587,783 | (319,977) | |||
| Cash and cash equivalents, beginning of period | 977,215 | 355,491 | 338,648 | 658,625 | |||
| Cash and cash equivalents, end of period | $ 926,431 | $ 338,648 | $ 926,431 | $ 338,648 | |||
| SUPPLEMENTAL CASH FLOW INFORMATION | |||||||
| Interest paid | $ 26,919 | $ 31,736 | $ 103,692 | $ 104,845 | |||
| Income and mining taxes paid | $ 96,473 | $ 82,856 | $ 474,028 | $ 290,525 |
| Notes: |
| (i) Certain previously reported line items have been restated to reflect the final purchase price allocation of the Yamana Transaction. |
| (ii) Revaluation gain on the 50% interest the Company previously owned in Canadian Malartic prior to the Yamana Transaction. |
SOURCE Agnico Eagle Mines Limited